|

GBP/USD technical analysis: Cable losing steam below 1.2570 resistance

  • GBP/USD is retreating from the 1.2570 resistance.
  • To the downside supports are seen at the 1.2510 and 1.2477 levels.  
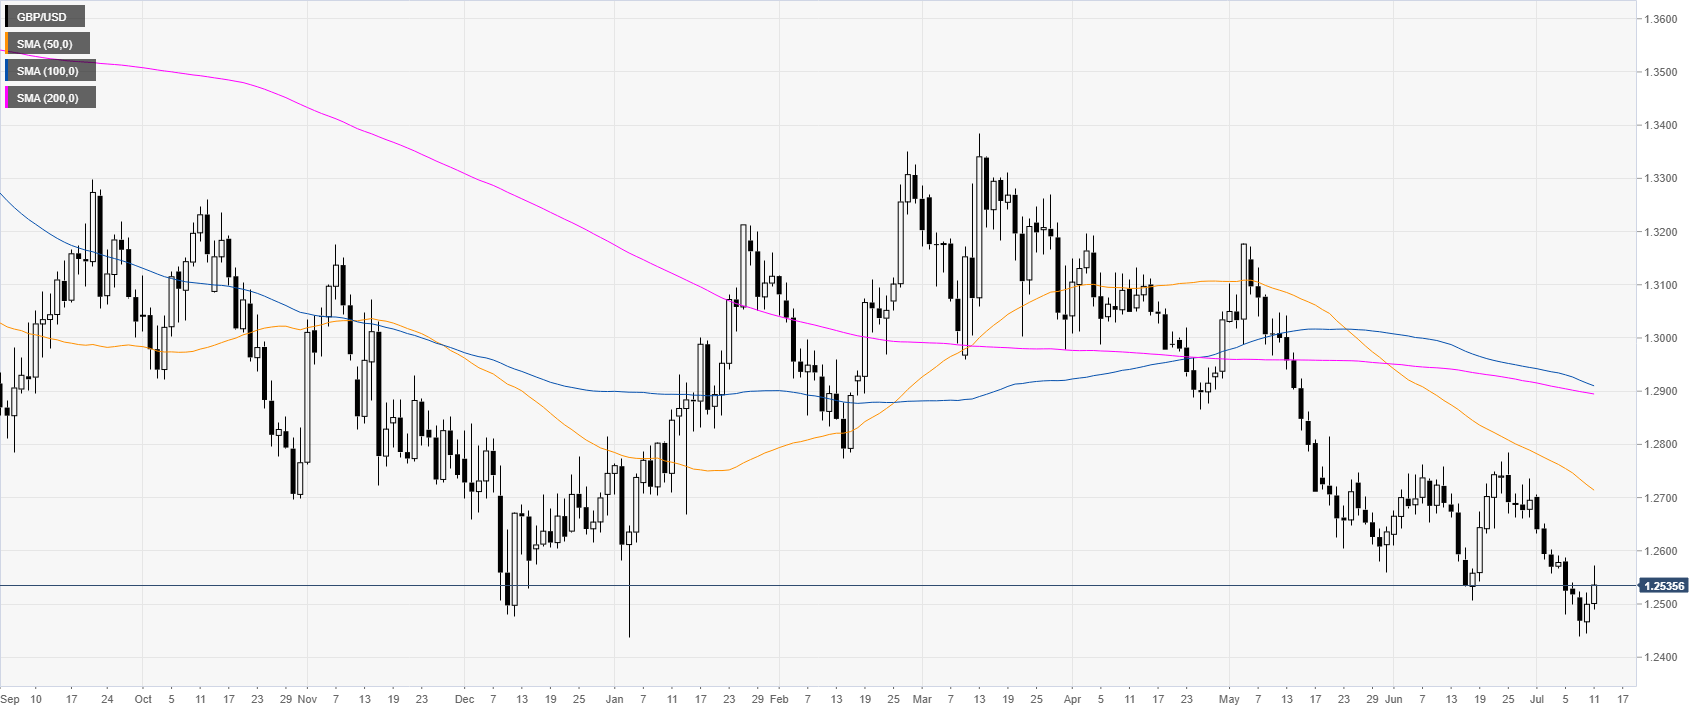
GBP/USD daily chart

GBP/USD is trading in a bear trend below its main daily simple moving averages (DSMAs). The market is correcting up after Fed’s Powell dovish comments on Wednesday.

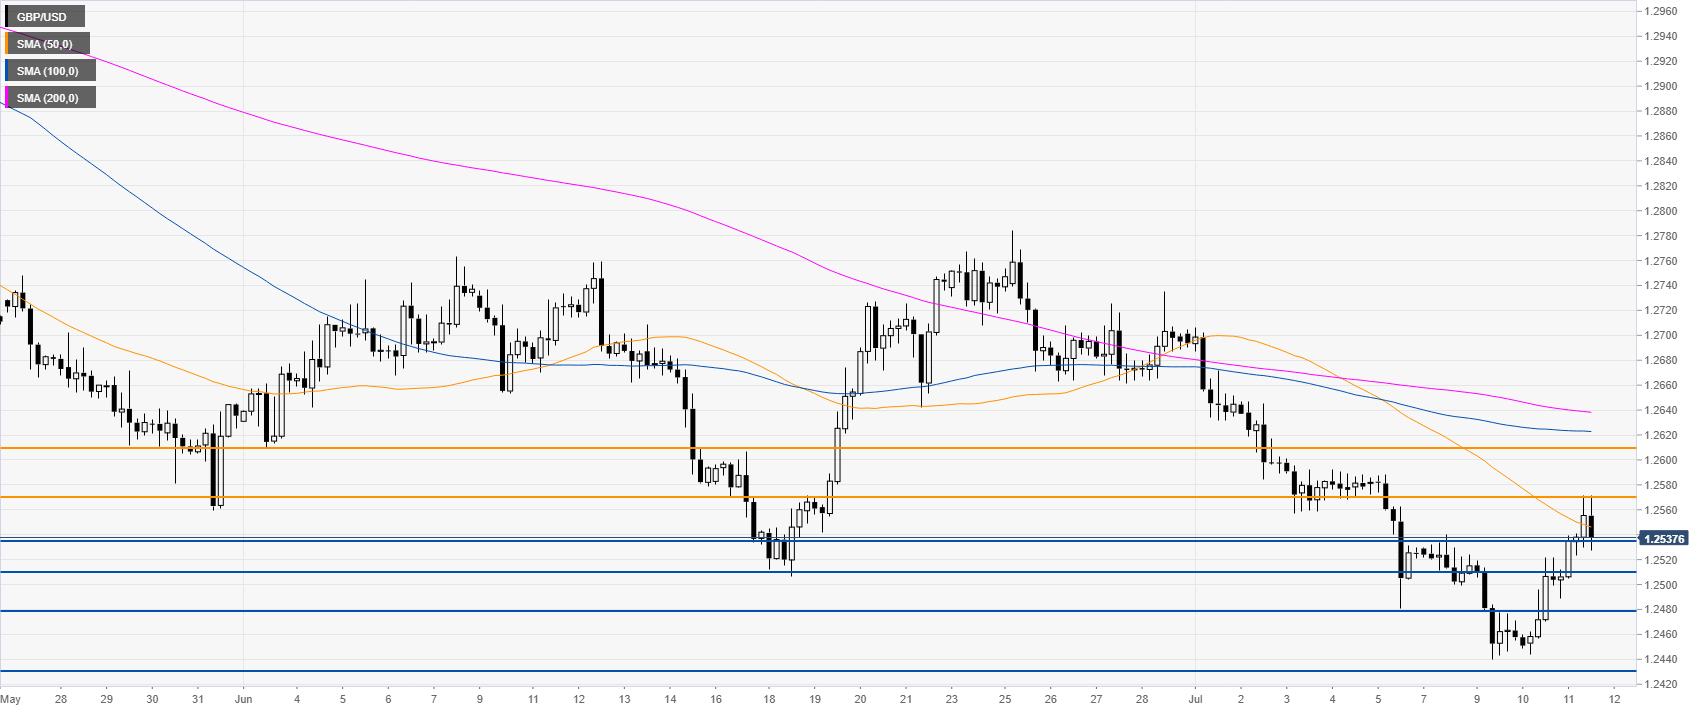
GBP/USD 4-hour chart

GBP/USD is finding resistance at 1.2570 and the 50 SMA as the market remains bearish. To the downside, supports are seen at 1.2535, 1.2510 and 1.2477 according to the Technical Confluences Indicator. 

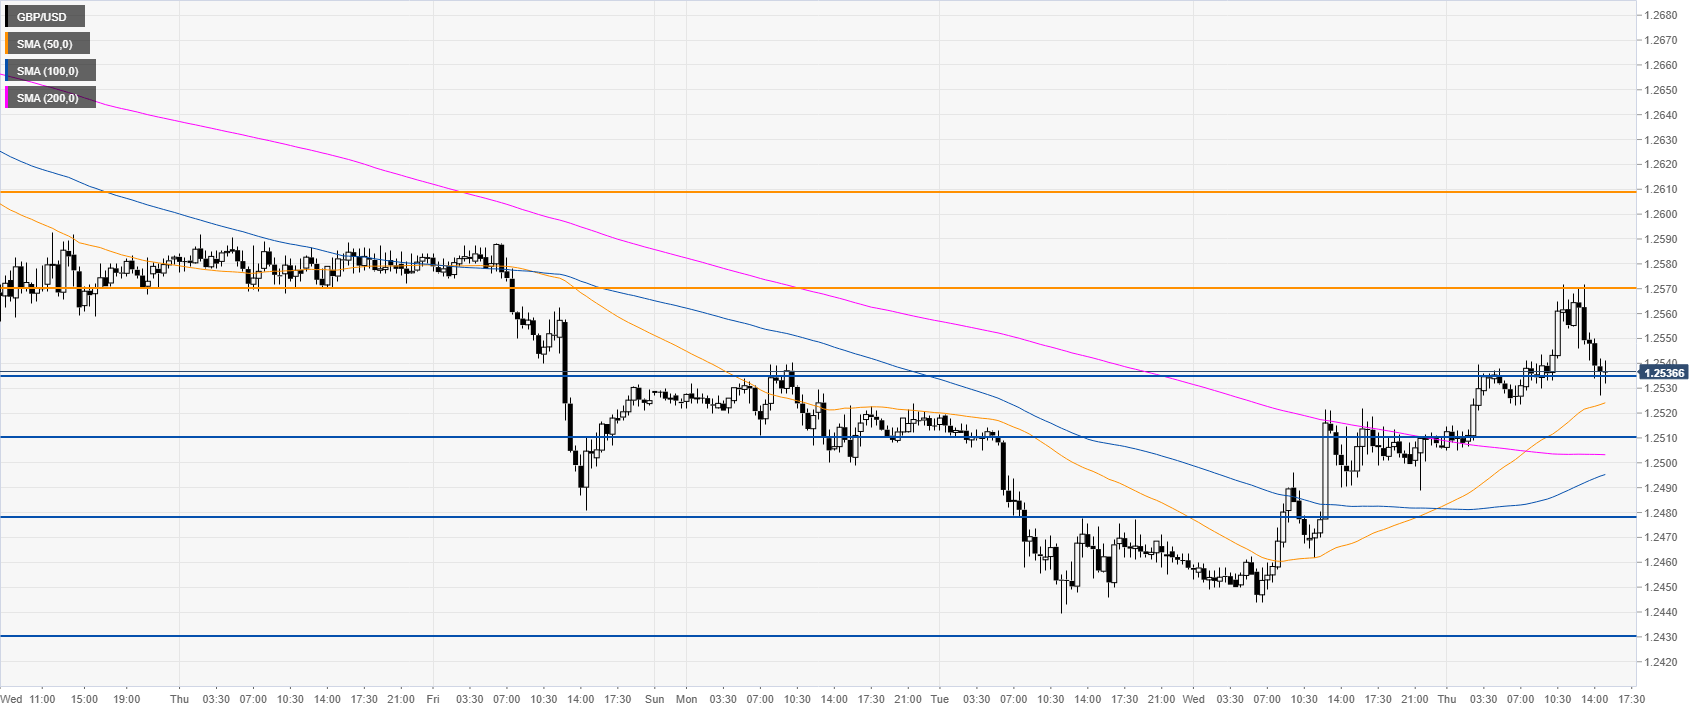
GBP/USD 30-minute chart

GBP/USD is trading above its main SMAs suggesting bullish momentum in the near term. Resistances can be seen near the 1.2570 and 1.2610 levels, according to the Technical Confluences Indicator.

Additional key levels

GBP/USD

Overview
Today last price1.2537
Today Daily Change0.0038
Today Daily Change %0.30
Today daily open1.2499
 
Trends
Daily SMA201.2617
Daily SMA501.2724
Daily SMA1001.2915
Daily SMA2001.2897
Levels
Previous Daily High1.2522
Previous Daily Low1.2444
Previous Weekly High1.2706
Previous Weekly Low1.2481
Previous Monthly High1.2784
Previous Monthly Low1.2506
Daily Fibonacci 38.2%1.2492
Daily Fibonacci 61.8%1.2474
Daily Pivot Point S11.2455
Daily Pivot Point S21.241
Daily Pivot Point S31.2377
Daily Pivot Point R11.2533
Daily Pivot Point R21.2567
Daily Pivot Point R31.2611

Author

Flavio Tosti

Flavio Tosti

Independent Analyst


More from Flavio Tosti
Share:

Editor's Picks

EUR/USD stays well offered below 1.1800

The selling pressure on EUR/USD is picking up pace, with the pair slipping decisively below the key 1.1800 level and sliding to fresh two week lows as Wednesday’s session draws to a close. The move lower comes as the US Dollar finds renewed strength after the latest round of US data and the release of the FOMC Minutes. Next of note on the docket will be the US weekly Initial Jobless Claims.
 

GBP/USD reaches multi-day lows near 1.3500

GBP/USD reverses its initial upside momentum and is now adding to previous declines, approaching the 1.3500 region on Wednesday. Cable’s downtick comes on the back of decent gains in the Greenback and easing UK inflation figures, which seem to have reinforced the case for a BoE rate cut in March.

Gold battle to regain $5,000 continues

Gold is back on the front foot on Wednesday, shaking off part of the early week softness and challenging two-day highs near the $5,000 mark per troy ounce. The move comes ahead of the FOMC Minutes and is unfolding despite an intense rebound in the US Dollar.

Bitcoin has found or is near a bottom, extended consolidation to follow: K33

Bitcoin (BTC) is nearing or has already established a bottom, which could be followed by a sustained period of slow price movement, according to K33.

Mixed UK inflation data no gamechanger for the Bank of England

Food inflation plunged in January, but service sector price pressure is proving stickier. We continue to expect Bank of England rate cuts in March and June. The latest UK inflation read is a mixed bag for the Bank of England, but we doubt it drastically changes the odds of a March rate cut.

Sui extends sideways action ahead of Grayscale’s GSUI ETF launch

Sui is extending its downtrend for the second consecutive day, trading at 0.95 at the time of writing on Wednesday. The Layer-1 token is down over 16% in February and approximately 34% from the start of the year, aligning with the overall bearish sentiment across the crypto market.