|
GBP/USD technical analysis: Cable is melting down nearing the 1.2700 figure

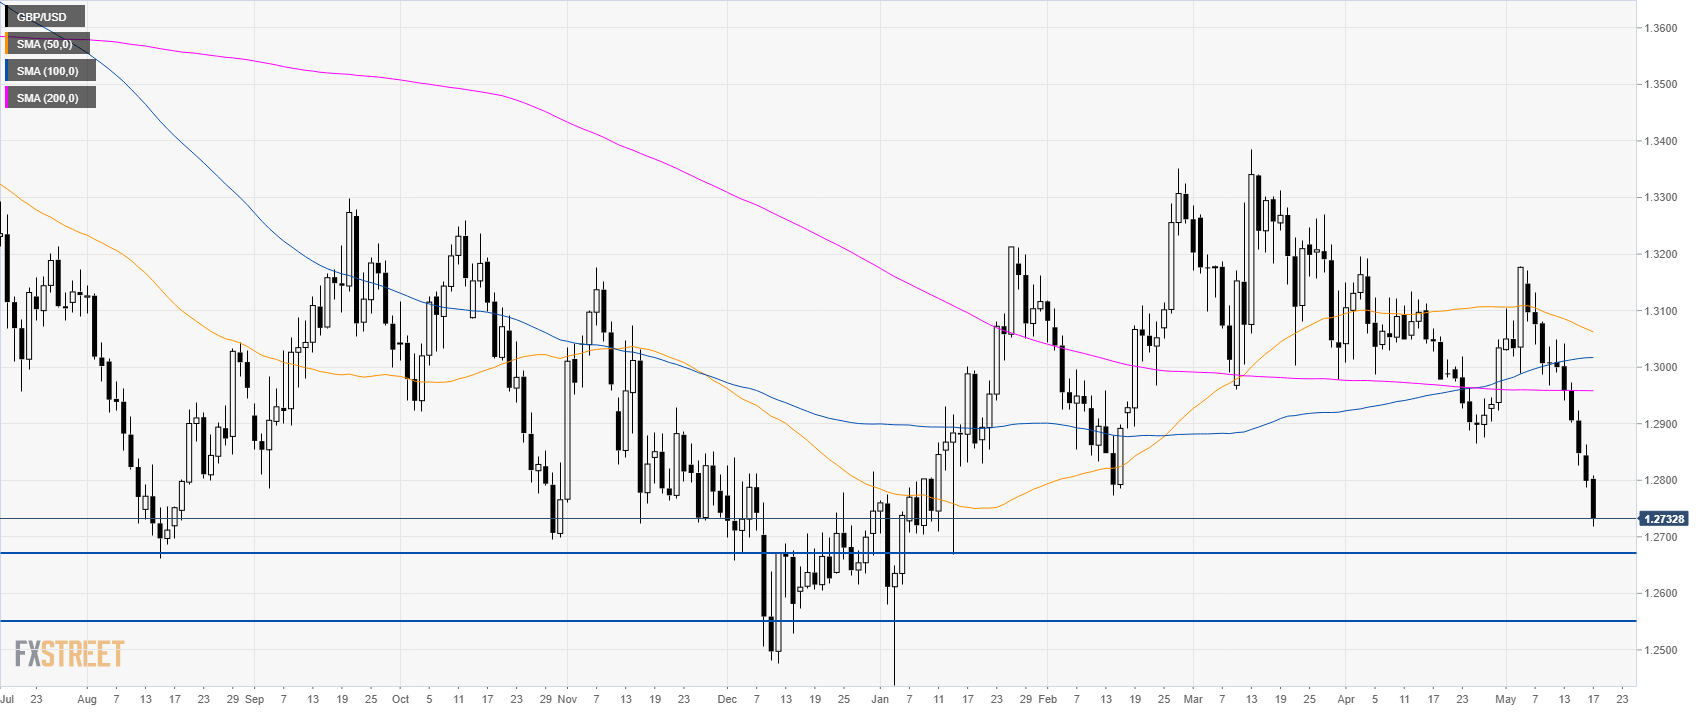
GBP/USD daily chart
GBP/USD is in free fall below its main simple moving averages (SMAs). The market can continue to fall towards, 1.2700 figure, 1.2670 swing low and 1.2550 figure.
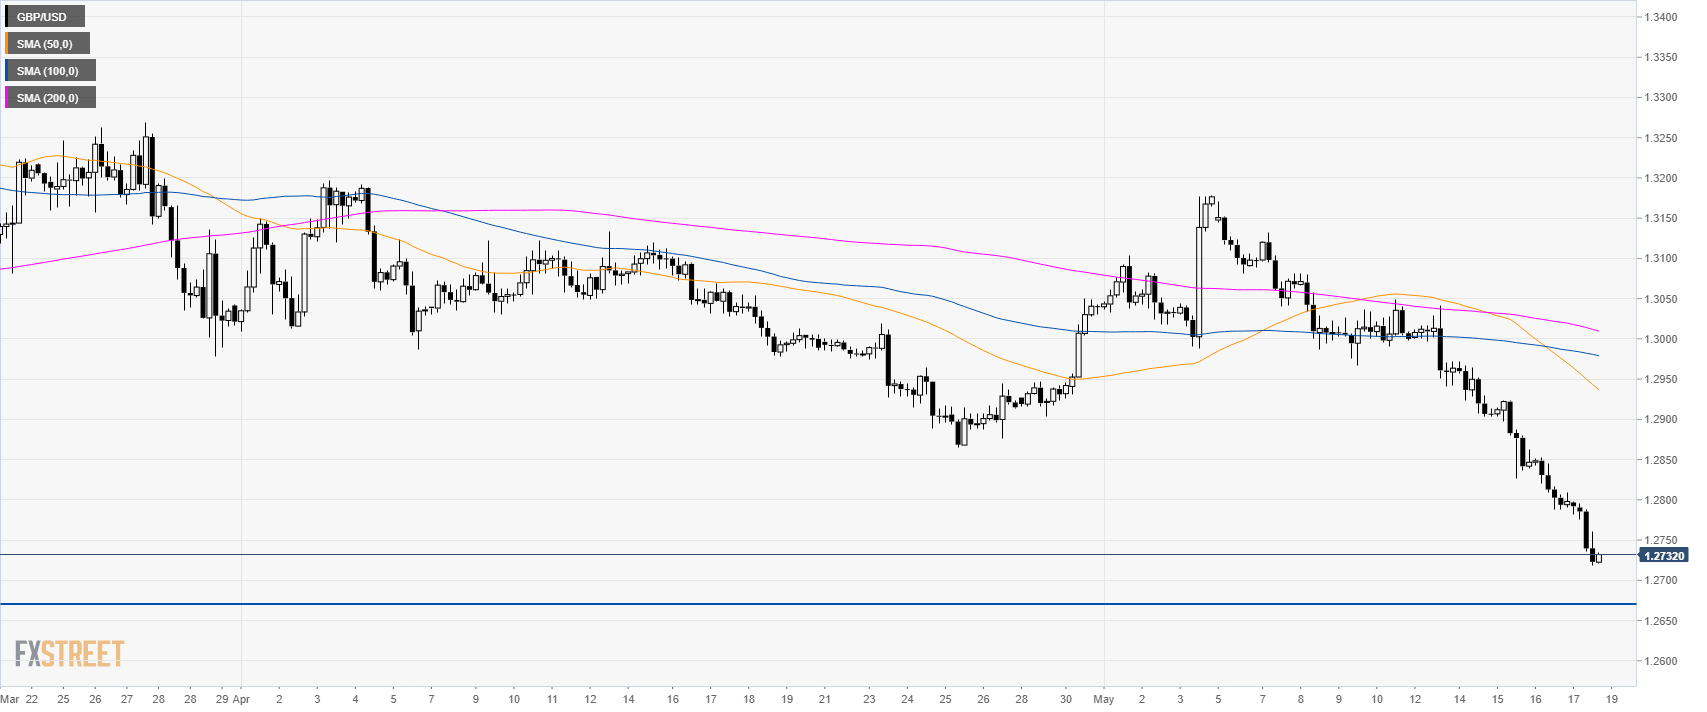
GBP/USD 4-hour chart
GBP/USD is trading steeply down below its main SMAs.
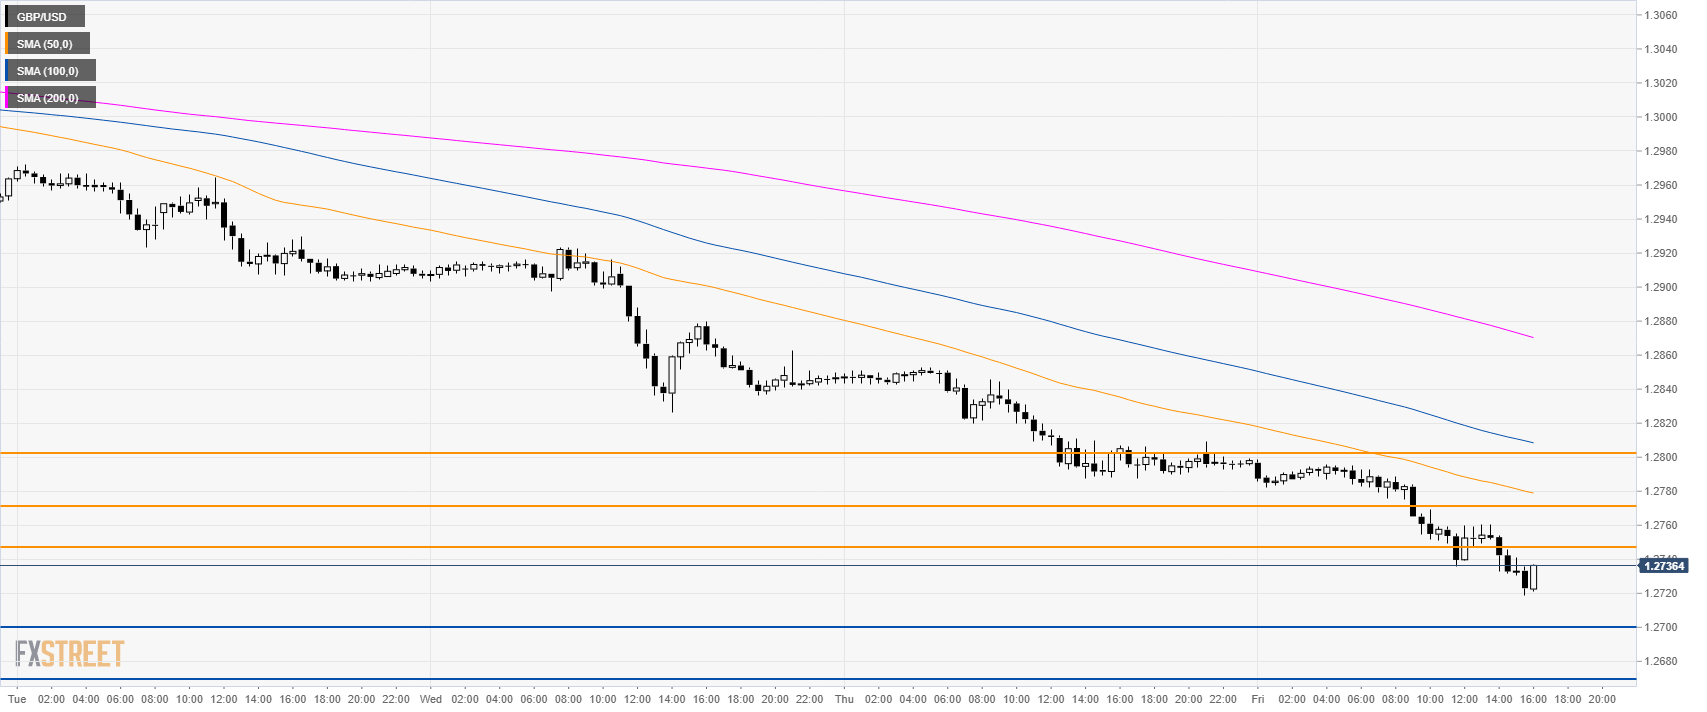
Cable is trading below its main SMAs as the market is breaking support levels one after another. To the downside, 1.2700 and 1.2670 can be next while 1.2750/70 and 1.2800 are seen as resistances.
Additional key levels
Author

Flavio Tosti
Independent Analyst
More from Flavio Tosti


