|

GBP/USD technical analysis: Cable flirting with weekly lows amid USD strength, sub-1.2180 level

  • After challenging the 1.2214 resistance, the Cable is hovering near weekly lows.
  • The levels to beat for sellers are seen at 1.2156, followed by 1.2125 support levels.
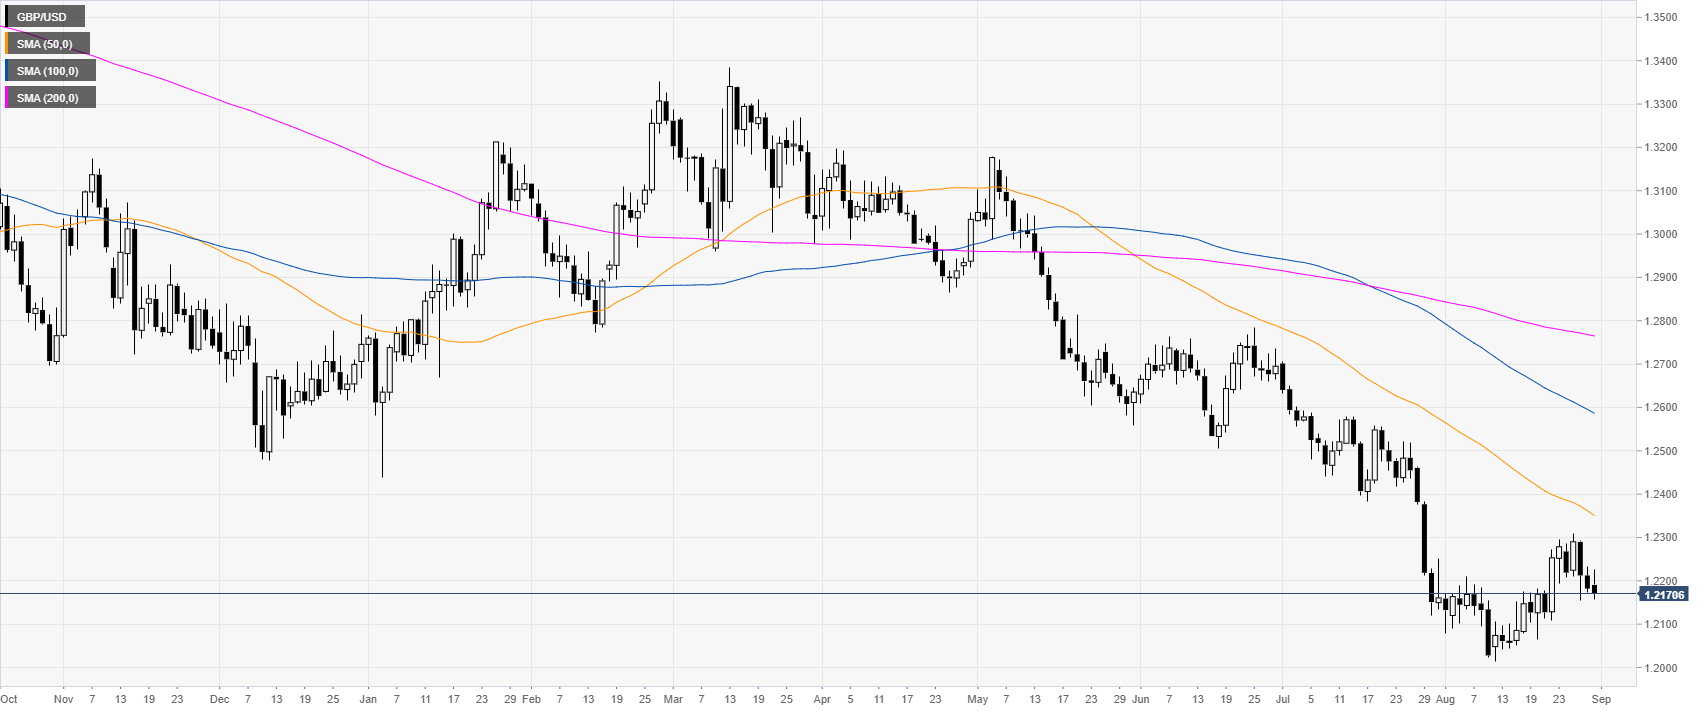
 

GBP/USD daily chart

 
The Sterling is trading in a bear trend below the main daily simple moving averages (SMAs). The market is on the defensive for the third day in a row as GBP/USD is trading below the 1.2300 figure.

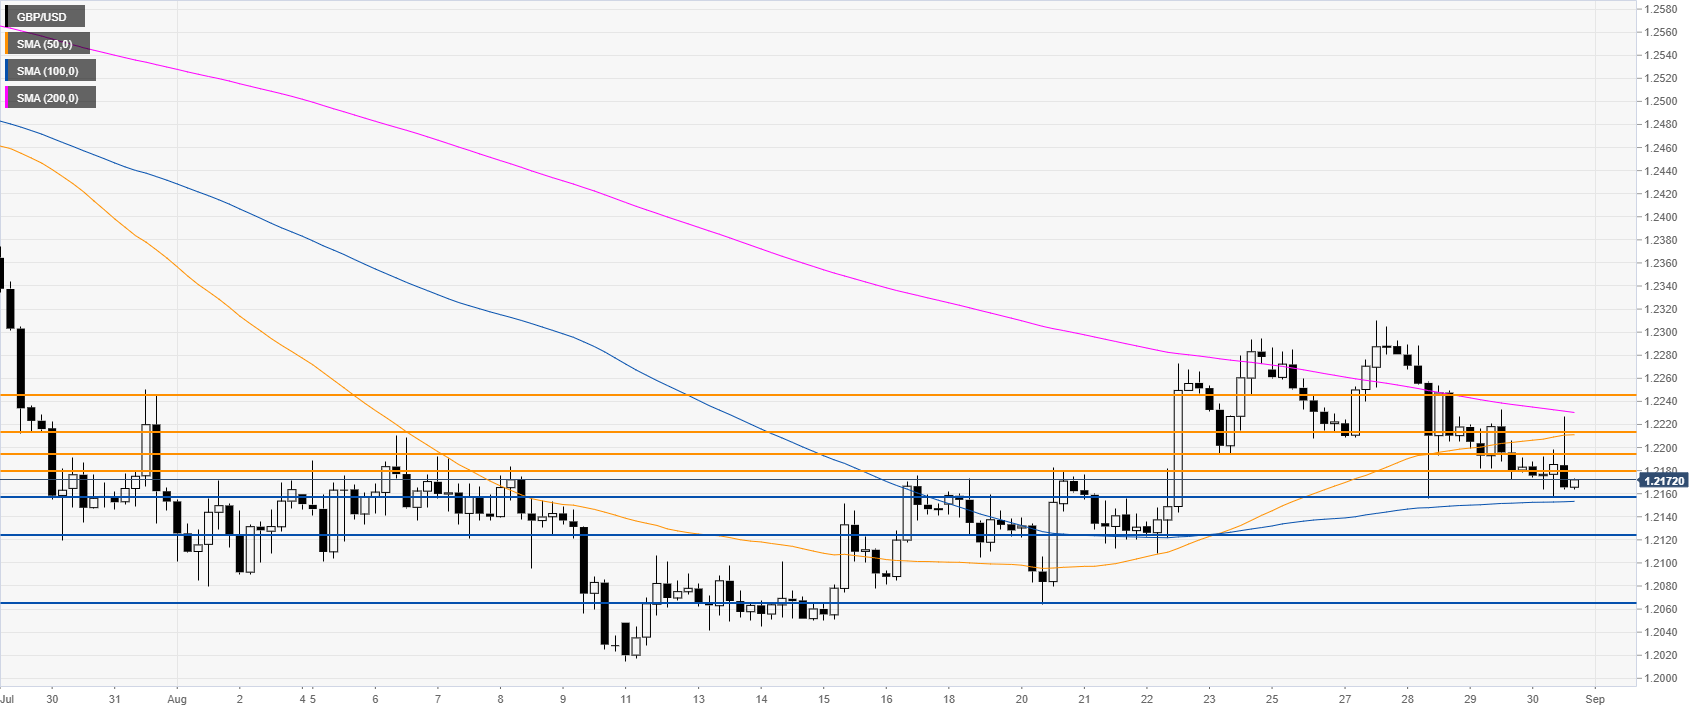
GBP/USD 4-hour chart

 
The Cable is trading below 1.2180 resistance and the 50/200 SMAs on the 4-hour time frame. GBP/USD bears are most likely looking for a break below the 1.2156 support and1.2125 level to potentially reach the 1.2065 level on the way down, according to the Technical Confluences Indicator.


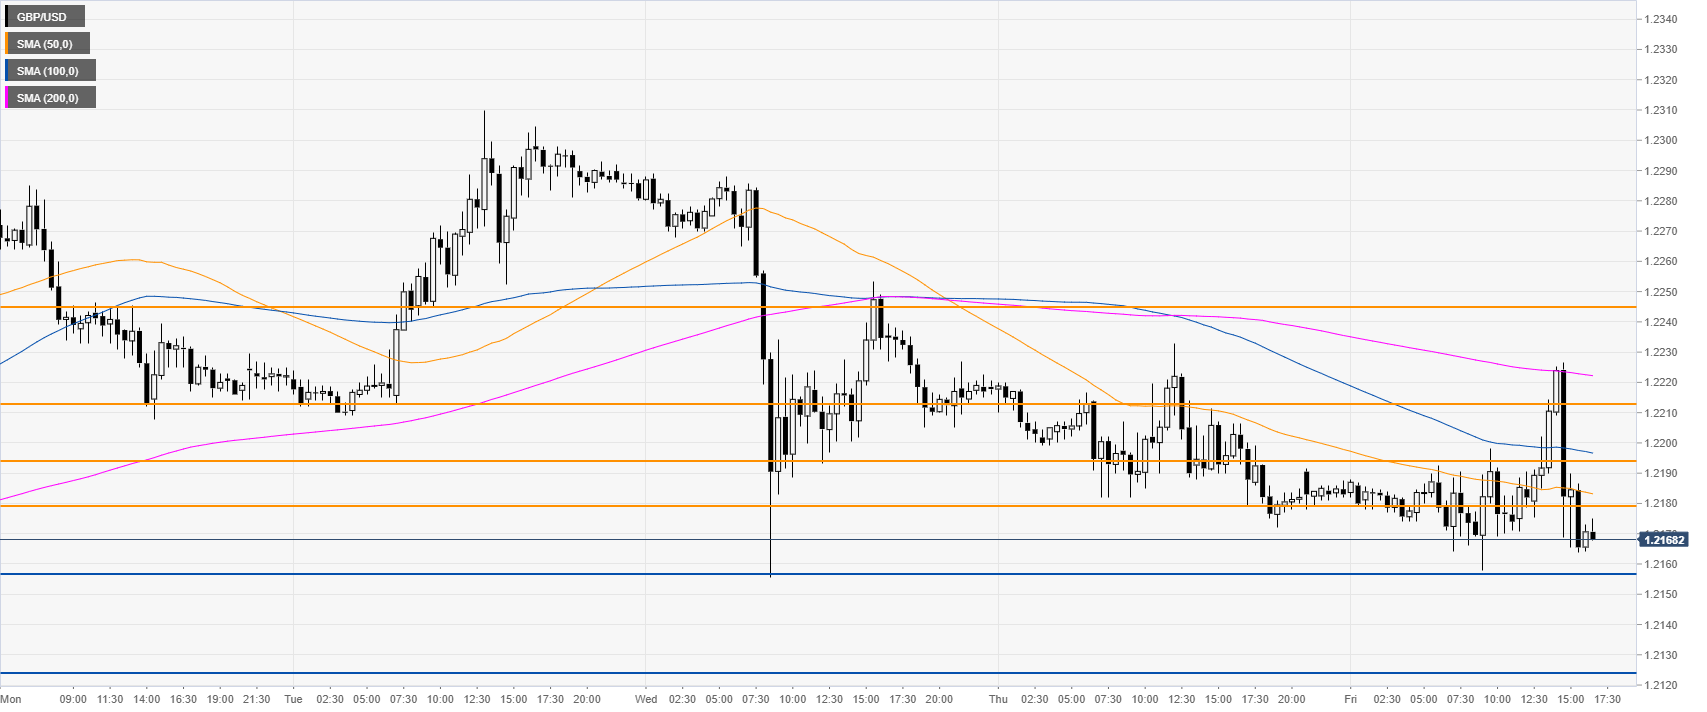
GBP/USD 30-minute chart

 
GBP/USD is trading below the main SMAs, suggesting a bearish bias in the near term. Immediate resistances are seen at the 1.2180, 1.2194, 1.2214 and 1.2245 levels, according to the Technical Confluences Indicator.

Additional key levels

GBP/USD

Overview
Today last price1.2171
Today Daily Change-0.0011
Today Daily Change %-0.09
Today daily open1.2182
 
Trends
Daily SMA201.2153
Daily SMA501.2362
Daily SMA1001.2595
Daily SMA2001.2768
Levels
Previous Daily High1.2233
Previous Daily Low1.2172
Previous Weekly High1.2294
Previous Weekly Low1.2064
Previous Monthly High1.2706
Previous Monthly Low1.2119
Daily Fibonacci 38.2%1.2195
Daily Fibonacci 61.8%1.221
Daily Pivot Point S11.2158
Daily Pivot Point S21.2135
Daily Pivot Point S31.2097
Daily Pivot Point R11.2219
Daily Pivot Point R21.2257
Daily Pivot Point R31.228

Author

Flavio Tosti

Flavio Tosti

Independent Analyst


More from Flavio Tosti
Share:

Editor's Picks

EUR/USD looks sidelined around 1.1850

EUR/USD remains on the back foot, extending its bearish tone and sliding towards the 1.1850 area to print fresh daily lows on Monday. The move lower comes as the US Dollar gathers modest traction, with thin liquidity and subdued volatility amplifying price swings amid the US market holiday.

GBP/USD flirts with daily lows near 1.3630

GBP/USD has quickly given back Friday’s solid gains, turning lower at the start of the week and drifting back towards the 1.3630 area. The focus now shifts squarely to Tuesday’s UK labour market report, which is likely to keep the quid firmly in the spotlight and could set the tone for Cable’s next move.

Gold loses momentum, eases below $5,000

Gold is giving back part of Friday’s sharp rebound, deflating below the key $5,000 mark per troy ounce as the new week gets underway. Modest gains in the US Dollar are keeping the metal in check, while thin trading conditions, due to the Presidents Day holiday in the US, are adding to the choppy and hesitant tone across markets.

Bitcoin consolidates as on-chain data show mixed signals

Bitcoin price has consolidated between $65,700 and $72,000 over the past nine days, with no clear directional bias. US-listed spot ETFs recorded a $359.91 million weekly outflow, marking the fourth consecutive week of withdrawals.

The week ahead: Key inflation readings and why the AI trade could be overdone

It is likely to be a quiet start to the week, with US markets closed on Monday for Presidents Day. European markets are higher across the board and gold is clinging to the $5,000 level after the tamer than expected CPI report in the US reduced haven flows to precious metals.

XRP steadies in narrow range as fund inflows, futures interest rise

Ripple is trading in a narrow range between $1.45 (immediate support) and $1.50 (resistance) at the time of writing on Monday. The remittance token extended its recovery last week, peaking at $1.67 on Sunday from the weekly open at $1.43.