GBP/USD struggles at 1.2500, retraces amidst US recession fears, Fed pause
- GBP/USD is forming a bearish-harami candlestick pattern with bearish implications.
- Private hiring and business activity in the US missed estimates as economic growth decelerated.
- Business activity in the UK expands, though inflation remains at double digits.

GBP/USD faces strong resistance at around 1.2500 and retraces due to risk aversion as investors assess a possible recession in the United States (US). The latest US economic data paints a gloomy scenario, which is already foreseen by the US Federal Reserve (Fed) as the last piece of the puzzle, the larbor market, showed signs of slowing down. The GBPUSD trades at 1.2459, down by 0.33%.
US equities continue to tumble across the board. The ISM revealed its non-manufacturing index, which rose by 51.2, below estimates and the prior’s month data. Earlier, private hiring in the US, as reported by ADP in collaboration with Stanford Digital Economy Lab, jumped to 145K, below the 200K consensus.
After the release of the figures, the GBP/USD seesawed in an extensive 70-pip range, from 1.2505-1.2432, before stabilizing around 1.2450. As business activity slows down, recessionary fears are growing amongst investors.
Aside from this, money market futures continued to price in that the US central bank, the Federal Reserve (Fed) would keep rates unchanged at their May meeting.
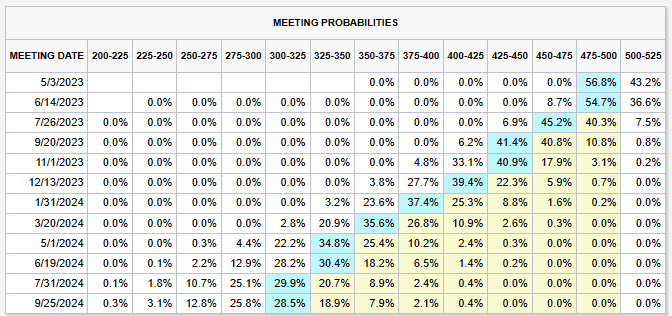
Source: CME FedWatch Tool
Aside from this, the UK economic docket featured the S$P Global/CIPS Services PMI, which came at 52.9, below estimates but at expansionary territory. However, fundamentally speaking, inflation in the UK remains at double-digit figures, though per the latest Bank of England (BoE) Monetary Policy Report (MPR), the central bank expected inflation to drop “significantly in Q2 2023.” That said, investors have begun to price in a less hawkish BoE, and for the next monetary policy meeting, odds for a no change sit at 54.5%.
GBP/USD Technical Analysis
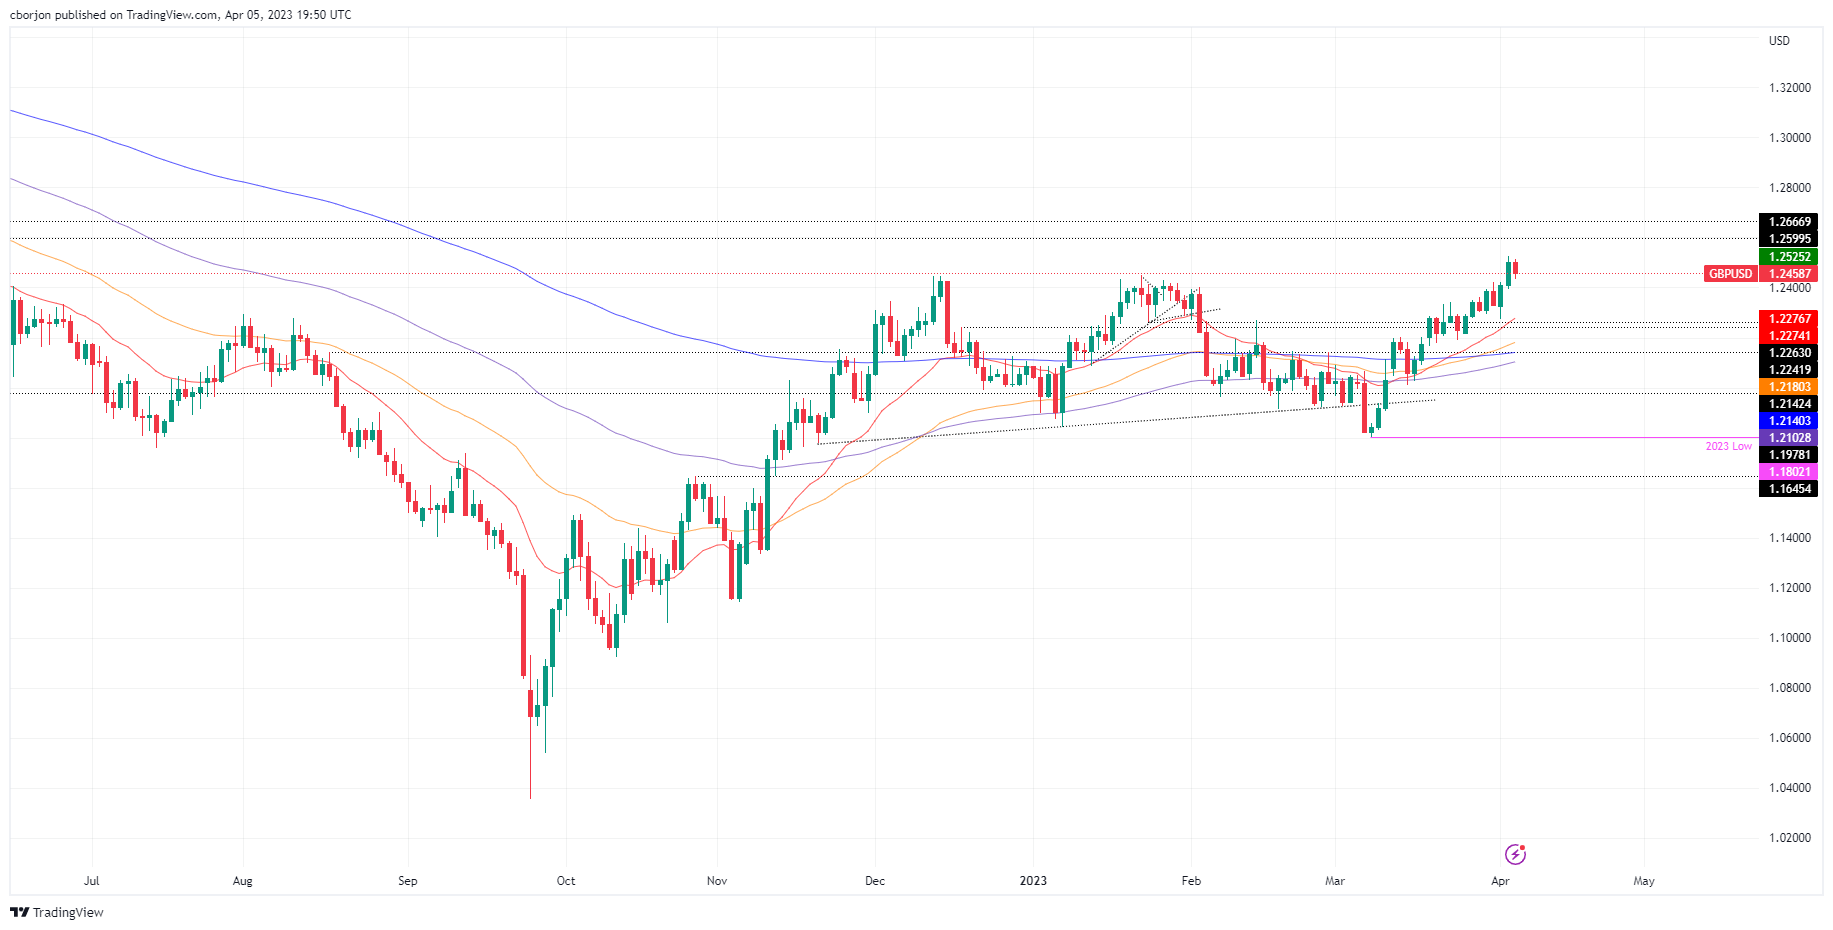
From a technical perspective, the GBP/USD appears to have peaked at around 1.2500. A daily close at current exchange rates would confirm the formation of a bearish-harami two-candlesticks pattern, suggesting further downside is expected. If GBP/USD tumbles below Tuesday’s low of 1.2394, the pair’s next support would be the 20-day EMA at 1.2276, followed by the psychological 1.2200 mark. Downside risks lie at the 50-day EMA.
Author

Christian Borjon Valencia
FXStreet
Markets analyst, news editor, and trading instructor with over 14 years of experience across FX, commodities, US equity indices, and global macro markets.


