GBP/USD Price Forecast: Soars towards 1.3400 on soft US data
- GBP/USD clears the top of an ascending channel and nears the YTD high of 1.3398.
- The Relative Strength Index (RSI) favors buyers, breaking above 70 despite entering overbought territory, signaling potential for further gains.
- Next resistance levels include the March 1, 2022, high at 1.3437 and the psychological 1.3500 mark.
- A pullback could see the pair test support at 1.3350, with further downside targeting 1.3298, 1.3266, and the 1.3200 figure.

The Pound Sterling extended its gains against the US Dollar on Tuesday amid a scarce economic docket in the UK. Across the pond, the US Conference Board Consumer Confidence tumbled on labor market views, sending the Greenback sliding and underpinning other currencies higher. The GBP/USD trades at 1.3388 and advances more than 0.30%.
GBP/USD Price Forecast: Technical outlook
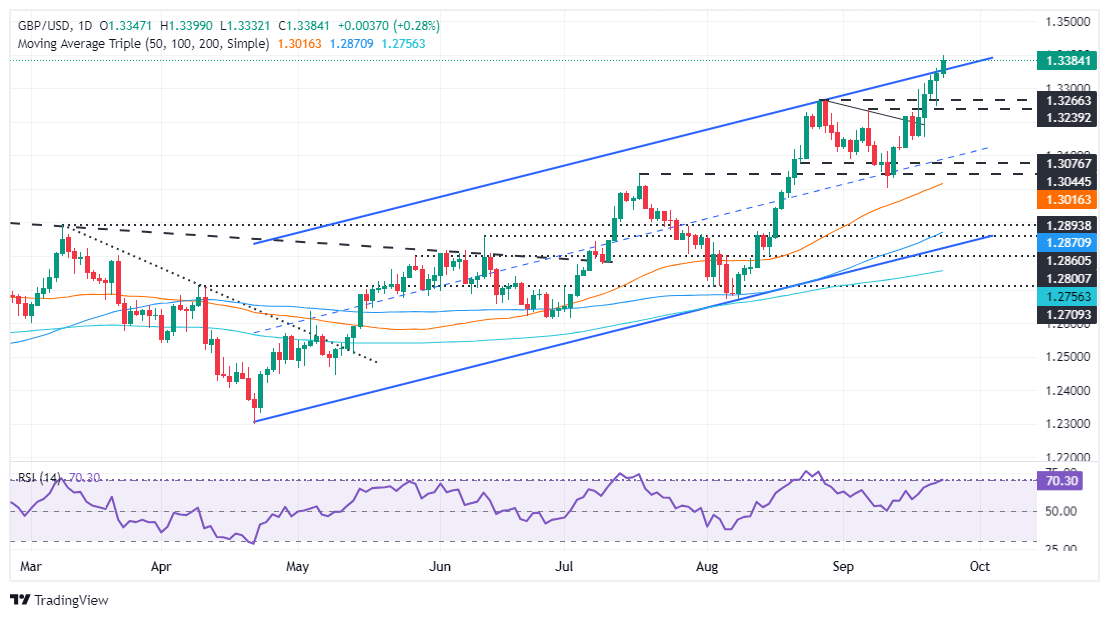
From a technical standpoint, the GBP/USD has cleared the top of an ascending channel, about to challenge the year-to-date (YTD) high of 1.3398, shy of the 1.34 handle. The Relative Strength Index (RSI) favors buyers despite breaking above the 70 marks, seen as overbought territory. However, this could exacerbate a leg-up, before retreating to lower prices.
The next key resistance for GBP/USD will be the March 1, 2022, daily high at 1.3437, followed by the 1.3500 figure. Conversely, if the exchange rate drops below 1.3350, this could pave the way for a pullback. The next support will be the March 23, 2022, daily peak turned support at 1.3298, followed by the August 27 high at 1.3266 and the 1.3200 mark.
GBP/USD Price Action – Daily Chart
Pound Sterling FAQs
The Pound Sterling (GBP) is the oldest currency in the world (886 AD) and the official currency of the United Kingdom. It is the fourth most traded unit for foreign exchange (FX) in the world, accounting for 12% of all transactions, averaging $630 billion a day, according to 2022 data. Its key trading pairs are GBP/USD, aka ‘Cable’, which accounts for 11% of FX, GBP/JPY, or the ‘Dragon’ as it is known by traders (3%), and EUR/GBP (2%). The Pound Sterling is issued by the Bank of England (BoE).
The single most important factor influencing the value of the Pound Sterling is monetary policy decided by the Bank of England. The BoE bases its decisions on whether it has achieved its primary goal of “price stability” – a steady inflation rate of around 2%. Its primary tool for achieving this is the adjustment of interest rates. When inflation is too high, the BoE will try to rein it in by raising interest rates, making it more expensive for people and businesses to access credit. This is generally positive for GBP, as higher interest rates make the UK a more attractive place for global investors to park their money. When inflation falls too low it is a sign economic growth is slowing. In this scenario, the BoE will consider lowering interest rates to cheapen credit so businesses will borrow more to invest in growth-generating projects.
Data releases gauge the health of the economy and can impact the value of the Pound Sterling. Indicators such as GDP, Manufacturing and Services PMIs, and employment can all influence the direction of the GBP. A strong economy is good for Sterling. Not only does it attract more foreign investment but it may encourage the BoE to put up interest rates, which will directly strengthen GBP. Otherwise, if economic data is weak, the Pound Sterling is likely to fall.
Another significant data release for the Pound Sterling is the Trade Balance. This indicator measures the difference between what a country earns from its exports and what it spends on imports over a given period. If a country produces highly sought-after exports, its currency will benefit purely from the extra demand created from foreign buyers seeking to purchase these goods. Therefore, a positive net Trade Balance strengthens a currency and vice versa for a negative balance.
Author

Christian Borjon Valencia
FXStreet
Markets analyst, news editor, and trading instructor with over 14 years of experience across FX, commodities, US equity indices, and global macro markets.


