- GBP/USD remains above 1.3100, with RSI showing buyers in control and eyeing 1.3200 resistance.
- Clearing 1.3179 would open the door to challenge the March 2022 high of 1.3298, with further upside to 1.3437.
- A pullback below 1.3150 could lead to testing key support at 1.3100 and 1.3044, with the 50-DMA at 1.2914.
The GBP/USD aims up during the North American session, after jobs data from the United States (US) was mixed, while business activity expanded. Despite this, the pair clings to its gains and trades at 1.3166 above its opening price by 0.15% at the time of writing.
GBP/USD Price Forecast: Technical outlook
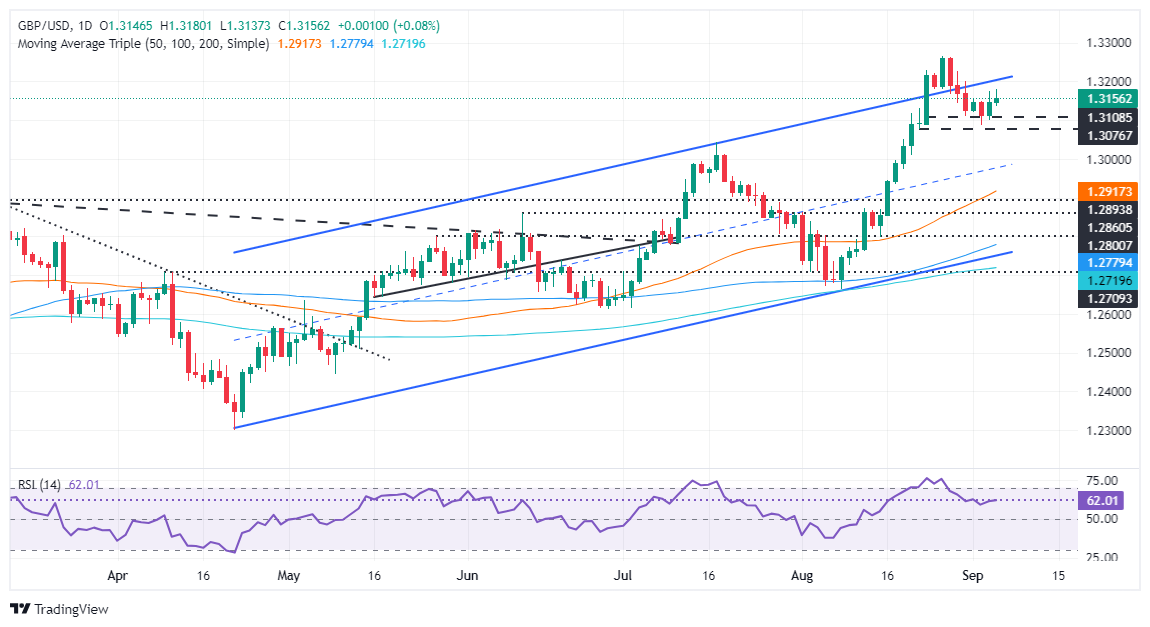
The GBP/USD has remained above the 1.3100 figure but has been capped on the upside so far as traders await the release of August’s Nonfarm Payrolls on Friday. The Relative Strength Index (RSI) shows that buyers are in charge and could sponsor a leg-up towards 1.3200.
If GBP/USD resumes to the upside and clears 1.3179, a move to 1.3200 will be made on the cards. A breach of the latter and will expose the March 23, 2022, peak at 1.3298 before challenging the March 1, 2022, cycle high at 1.3437.
Conversely if sellers step in and push GBP/USD below 1.3150, look for a pullback to 1.3100. Despite this, bears must clear the September 3 low of 1.3087 if they remain hopeful of lower exchange rates. The next key support levels would be July 17, high at 1.3044, followed by the 1.3000 figure and the 50-day moving average (DMA) at 1.2914.
GBP/USD Price Action – Daily Chart
British Pound PRICE Today
The table below shows the percentage change of British Pound (GBP) against listed major currencies today. British Pound was the strongest against the Swiss Franc.
USD | EUR | GBP | JPY | CAD | AUD | NZD | CHF | |
---|---|---|---|---|---|---|---|---|
USD | 0.03% | -0.09% | 0.14% | 0.06% | 0.04% | -0.11% | 0.22% | |
EUR | -0.03% | -0.10% | 0.16% | 0.06% | 0.01% | -0.09% | 0.19% | |
GBP | 0.09% | 0.10% | 0.23% | 0.17% | 0.11% | 0.00% | 0.29% | |
JPY | -0.14% | -0.16% | -0.23% | -0.09% | -0.13% | -0.27% | 0.06% | |
CAD | -0.06% | -0.06% | -0.17% | 0.09% | -0.02% | -0.16% | 0.14% | |
AUD | -0.04% | -0.01% | -0.11% | 0.13% | 0.02% | -0.12% | 0.18% | |
NZD | 0.11% | 0.09% | -0.01% | 0.27% | 0.16% | 0.12% | 0.30% | |
CHF | -0.22% | -0.19% | -0.29% | -0.06% | -0.14% | -0.18% | -0.30% |
The heat map shows percentage changes of major currencies against each other. The base currency is picked from the left column, while the quote currency is picked from the top row. For example, if you pick the British Pound from the left column and move along the horizontal line to the US Dollar, the percentage change displayed in the box will represent GBP (base)/USD (quote).
Information on these pages contains forward-looking statements that involve risks and uncertainties. Markets and instruments profiled on this page are for informational purposes only and should not in any way come across as a recommendation to buy or sell in these assets. You should do your own thorough research before making any investment decisions. FXStreet does not in any way guarantee that this information is free from mistakes, errors, or material misstatements. It also does not guarantee that this information is of a timely nature. Investing in Open Markets involves a great deal of risk, including the loss of all or a portion of your investment, as well as emotional distress. All risks, losses and costs associated with investing, including total loss of principal, are your responsibility. The views and opinions expressed in this article are those of the authors and do not necessarily reflect the official policy or position of FXStreet nor its advertisers. The author will not be held responsible for information that is found at the end of links posted on this page.
If not otherwise explicitly mentioned in the body of the article, at the time of writing, the author has no position in any stock mentioned in this article and no business relationship with any company mentioned. The author has not received compensation for writing this article, other than from FXStreet.
FXStreet and the author do not provide personalized recommendations. The author makes no representations as to the accuracy, completeness, or suitability of this information. FXStreet and the author will not be liable for any errors, omissions or any losses, injuries or damages arising from this information and its display or use. Errors and omissions excepted.
The author and FXStreet are not registered investment advisors and nothing in this article is intended to be investment advice.
Recommended content
Editors’ Picks

EUR/USD bounces off lows, back near 1.1330
EUR/USD meets daily support around the 1.1300 neighbourhood, managing to regain pace and revisit the 1.1330 region. Sentiment turned after President Trump proposed a “straight 50% tariff” on European imports, undermining the pair’s bullish momentum.

GBP/USD eases from tops, revisits the 1.3500 zone
GBP/USD benefits from broad US Dollar weakness, climbing to its highest level since February 2022 past 1.3500 at the end of the week. UK retail sales data surprised to the upside in April, lending extra wings to the quid.

Gold keeps the bullish tone near $3,350
Gold extends its weekly advance, trading around $3,350 per troy ounce on Friday. The rally in XAU/USD is driven by broad-based weakness in the Greenback, particulalry after President Trump’s threat to impose 50% tariffs on European imports.

Apple stock sinks below $200 after Trump threatens more tariffs Premium
Trump grows irate at Apple's move into India. President claims Apple must produce US-sold iPhone in US or face a 25% tariff. US equity futures slip more than 1% in Friday premarket after Trump threatens the EU with a 50% tariff.

Ripple Price Prediction: Whale accumulation sparks hope as rising exchange reserves signal caution
XRP sustains mid-week recovery as XRP/BTC flashes golden cross for the first time since 2017. Large volume holders increase XRP exposure, indicating rising demand and investor confidence.