GBP/USD Price Forecast: Drops below 1.3100 on mixed US ISM data
- GBP/USD slips below 1.3100 despite RSI giving mixed signals.
- RSI trends bullish but momentum shifts to sellers, descending towards neutral.
- A drop below 1.3100, GBP/USD could test July 17 high at 1.3043; further drops may reach psychological 1.3000, then 50-DMA at 1.2894.
- Bullish trend resumes if GBP/USD sustains above 1.3100, surpassing September 2 peak at 1.3155, aiming for channel top at 1.3200.

The GBP/USD makes a U-turn, dives in early trading on Tuesday during the North American session, losing around 0.20%, and trades at 1.3099, below the 1.3100 figure.
The US ISM Manufacturing PMI for August missed estimates, suggesting the economy is cooling due to the Fed's restrictive policy. However, an employment sub-component inside the report showed a slight improvement, which could be a prelude to Friday’s Nonfarm Payrolls report.
GBP/USD Price Forecast: Technical outlook
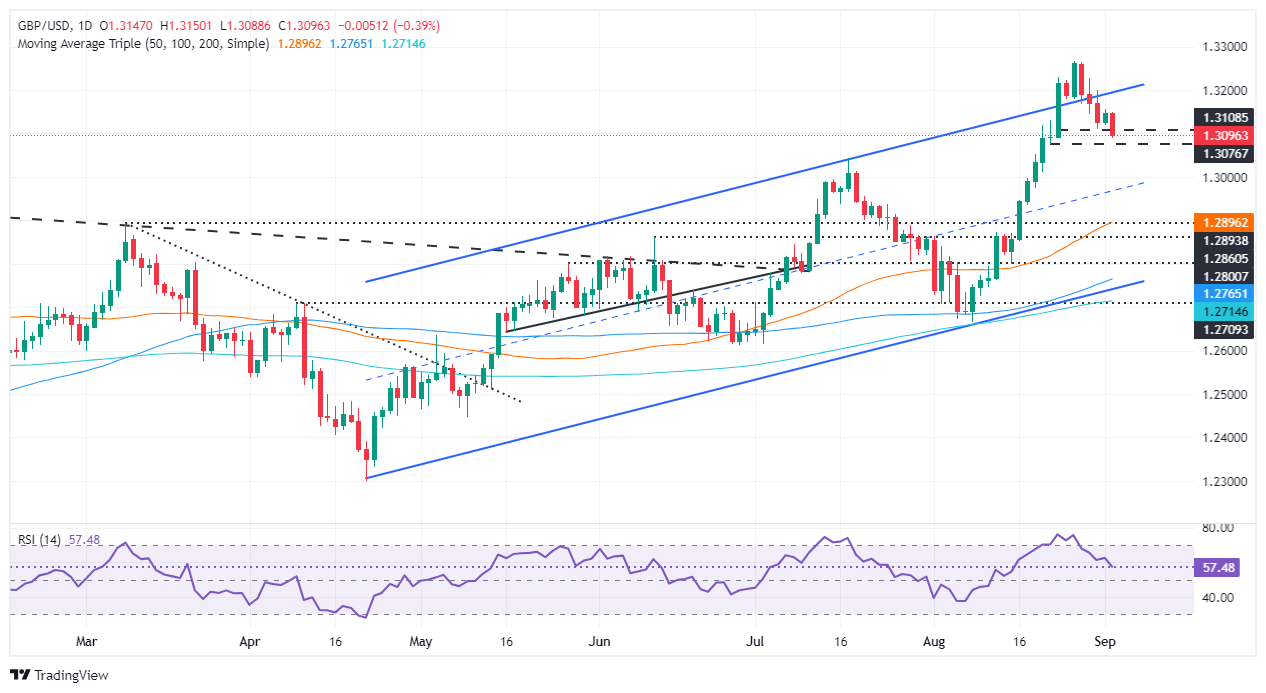
The GBP/USD slid sharply on the data release, about to crack the 1.3100 figure. The Relative Strength Index (RSI) remains bullish, but momentum has swung in the sellers' favor as the RSI aims lower, approaching its neutral level.
If GBP/USD tumbles below 1.3100, this could clear the path to test the 1.3043, July 17 high turned support. A drop below could cause the pair to test 1.3000, and if surpassed, the 50-day moving average (DMA) would be up next at 1.2894.
If bulls want to remain in charge, they must hold GBP/USD above 1.3100. For an uptrend resumption, clear the September 2 peak at 1.3155 before challenging the ascending channel top-trendline at 1.3200.
GBP/USD Price Action – Daily Chart
British Pound PRICE Today
The table below shows the percentage change of British Pound (GBP) against listed major currencies today. British Pound was the strongest against the Australian Dollar.
| USD | EUR | GBP | JPY | CAD | AUD | NZD | CHF | |
|---|---|---|---|---|---|---|---|---|
| USD | 0.28% | 0.40% | -1.03% | 0.41% | 1.07% | 0.88% | -0.25% | |
| EUR | -0.28% | 0.11% | -1.30% | 0.13% | 0.78% | 0.50% | -0.57% | |
| GBP | -0.40% | -0.11% | -1.43% | 0.02% | 0.67% | 0.39% | -0.67% | |
| JPY | 1.03% | 1.30% | 1.43% | 1.45% | 2.12% | 1.74% | 0.75% | |
| CAD | -0.41% | -0.13% | -0.02% | -1.45% | 0.63% | 0.28% | -0.69% | |
| AUD | -1.07% | -0.78% | -0.67% | -2.12% | -0.63% | -0.39% | -1.33% | |
| NZD | -0.88% | -0.50% | -0.39% | -1.74% | -0.28% | 0.39% | -0.95% | |
| CHF | 0.25% | 0.57% | 0.67% | -0.75% | 0.69% | 1.33% | 0.95% |
The heat map shows percentage changes of major currencies against each other. The base currency is picked from the left column, while the quote currency is picked from the top row. For example, if you pick the British Pound from the left column and move along the horizontal line to the US Dollar, the percentage change displayed in the box will represent GBP (base)/USD (quote).
Author

Christian Borjon Valencia
FXStreet
Markets analyst, news editor, and trading instructor with over 14 years of experience across FX, commodities, US equity indices, and global macro markets.


