GBP/USD Price Analysis: The potential support level is located near 1.2600
- GBP/USD trades on a stronger note near 1.2680 in Monday’s early European session.
- The pair maintains the negative stance on the 4-hour chart, with the bearish RSI indicator.
- The key resistance level will emerge in the 1.2680-1.2685 region; the initial support level is located at 1.2610.

The GBP/USD pair attracts some buyers around 1.2680 during the early European session on Monday. The decline of the Greenback after softer US Personal Consumption Expenditures (PCE) Price Index data creates a tailwind for the major pair. Investors will keep an eye on the US ISM Manufacturing PMI for June on Monday. The general election in the United Kingdom is scheduled for Thursday.
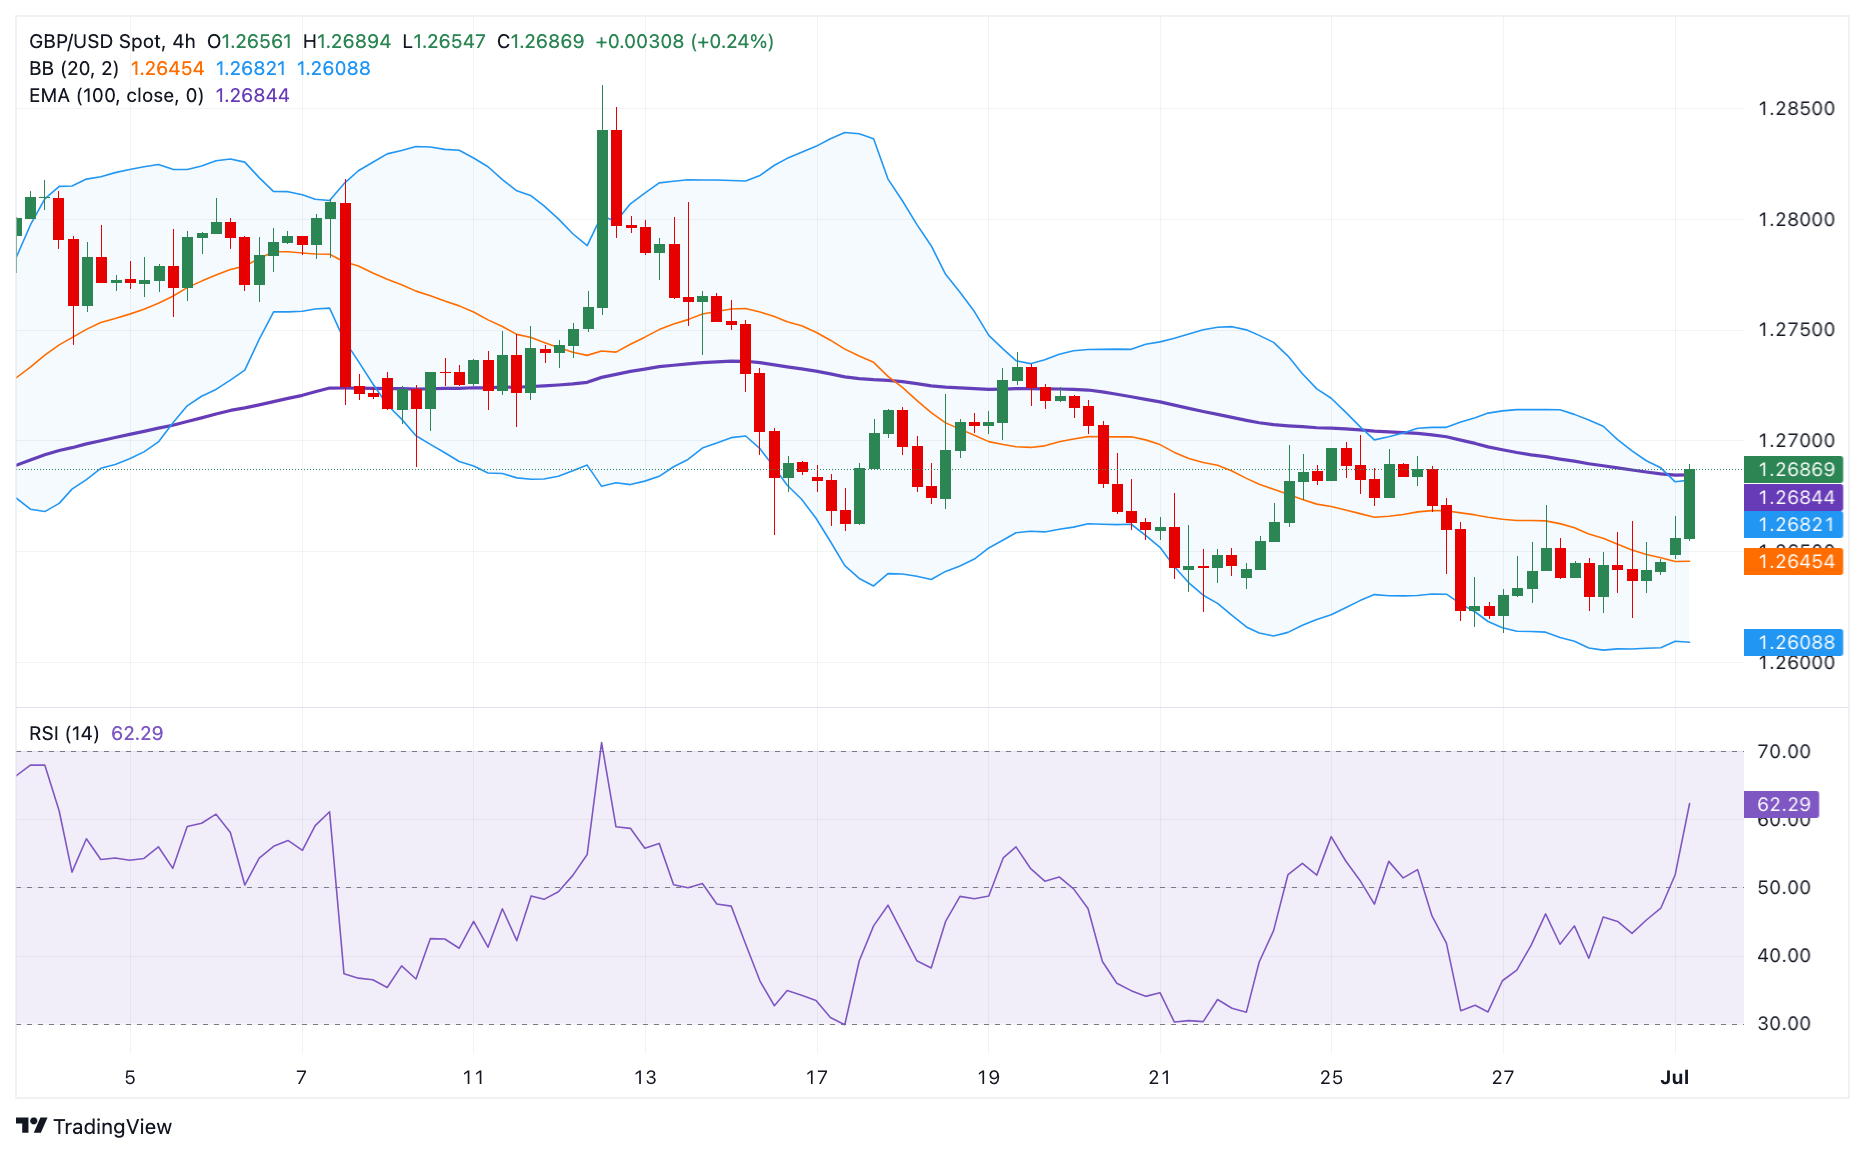
According to the 4-hour chart, the bearish outlook of GBP/USD remains intact as it holds below the key 100-period Exponential Moving Average (EMA). However, the Relative Strength Index (RSI) crosses above the 50-midline, indicating that further upside looks favorable.
The key resistance level for GBP/USD will emerge in the 1.2680-1.2685 zone, portraying the confluence of the upper boundary of the Bollinger Band and the 100-period EMA. A decisive break above this level will see a rally to 1.2700, the psychological level and a high of June 25. Further north, the next hurdle is seen at 1.2740, a high of June 19.
On the flip side, the initial support level for the major pair is located at 1.2610, the lower limit of the Bollinger Band. The additional downside filter to watch is 1.2583, a low of May 15. The next contention level is seen at 1.2502, a low of May 10.
GBP/USD 4-hour chart
Pound Sterling FAQs
The Pound Sterling (GBP) is the oldest currency in the world (886 AD) and the official currency of the United Kingdom. It is the fourth most traded unit for foreign exchange (FX) in the world, accounting for 12% of all transactions, averaging $630 billion a day, according to 2022 data. Its key trading pairs are GBP/USD, aka ‘Cable’, which accounts for 11% of FX, GBP/JPY, or the ‘Dragon’ as it is known by traders (3%), and EUR/GBP (2%). The Pound Sterling is issued by the Bank of England (BoE).
The single most important factor influencing the value of the Pound Sterling is monetary policy decided by the Bank of England. The BoE bases its decisions on whether it has achieved its primary goal of “price stability” – a steady inflation rate of around 2%. Its primary tool for achieving this is the adjustment of interest rates. When inflation is too high, the BoE will try to rein it in by raising interest rates, making it more expensive for people and businesses to access credit. This is generally positive for GBP, as higher interest rates make the UK a more attractive place for global investors to park their money. When inflation falls too low it is a sign economic growth is slowing. In this scenario, the BoE will consider lowering interest rates to cheapen credit so businesses will borrow more to invest in growth-generating projects.
Data releases gauge the health of the economy and can impact the value of the Pound Sterling. Indicators such as GDP, Manufacturing and Services PMIs, and employment can all influence the direction of the GBP. A strong economy is good for Sterling. Not only does it attract more foreign investment but it may encourage the BoE to put up interest rates, which will directly strengthen GBP. Otherwise, if economic data is weak, the Pound Sterling is likely to fall.
Another significant data release for the Pound Sterling is the Trade Balance. This indicator measures the difference between what a country earns from its exports and what it spends on imports over a given period. If a country produces highly sought-after exports, its currency will benefit purely from the extra demand created from foreign buyers seeking to purchase these goods. Therefore, a positive net Trade Balance strengthens a currency and vice versa for a negative balance.
Author

Lallalit Srijandorn
FXStreet
Lallalit Srijandorn is a Parisian at heart. She has lived in France since 2019 and now becomes a digital entrepreneur based in Paris and Bangkok.


