|

GBP/USD Price Analysis: Pound sinks further in 6-week lows, bearish

  • GBP/USD is under heavy bearish pressure near 6-week lows.  
  • The level to beat for sellers is the 1.2100 figure. 
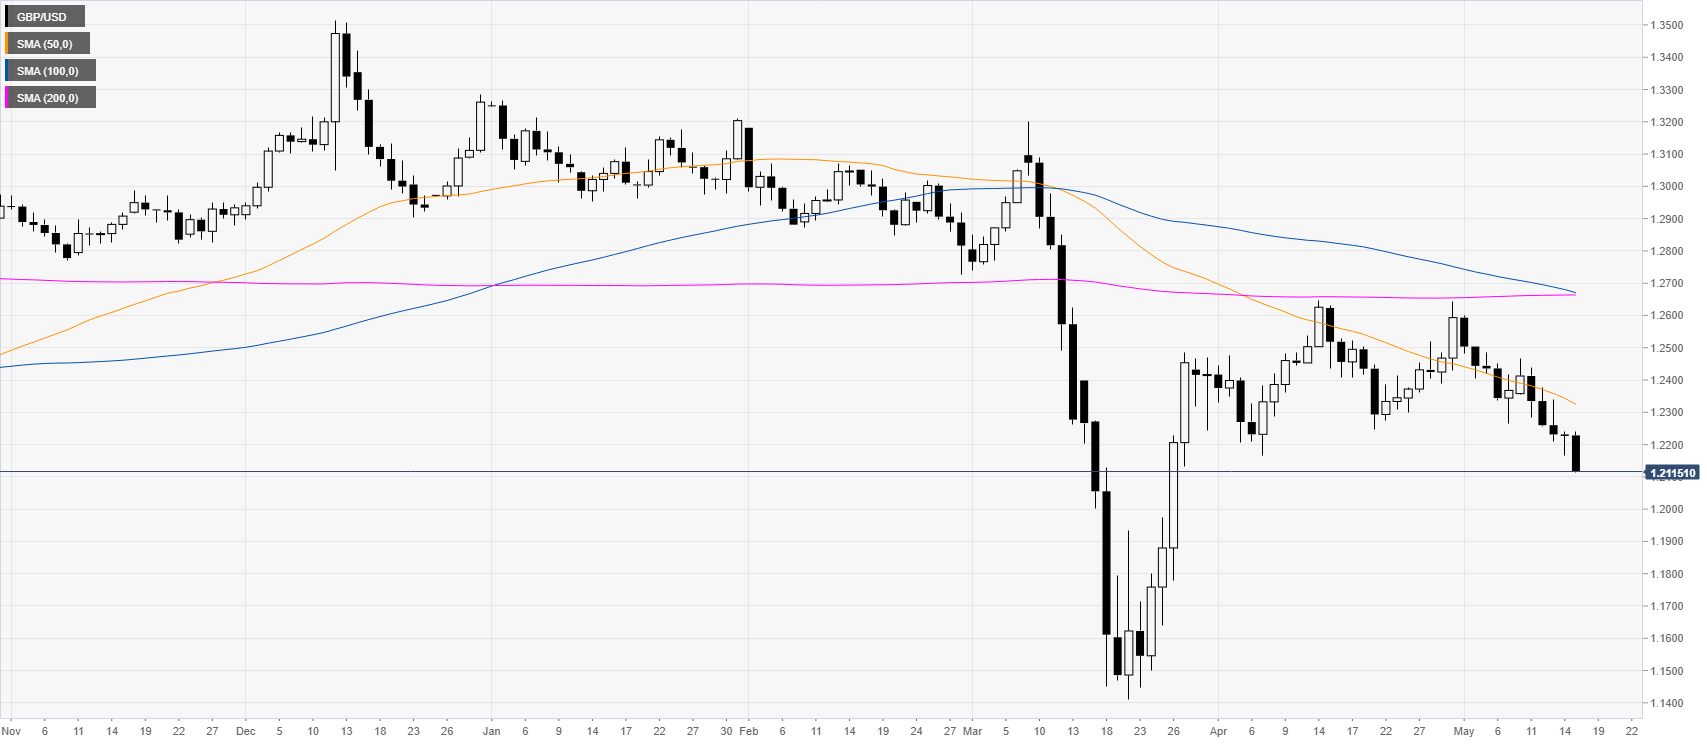
 

GBP/USD daily chart

 
GBP/USD is trading below the main SMAs on the daily chart suggesting a bearish bias as the market is under heavy selling pressure in 6-week lows. 


GBP/USD four-hour chart

 
GBP/USD is trading down below its main SMAs on the four-hour chart as the bears are nearing the 1.2100 figure. Sellers remain in full control of GBP/USD which is seen keeping printing lower prices and reach the 1.2100 and 1.1950 levels in the medium-term. Occasional bullish attempts could find resistance near 1.2200 and 1.2300 levels. 


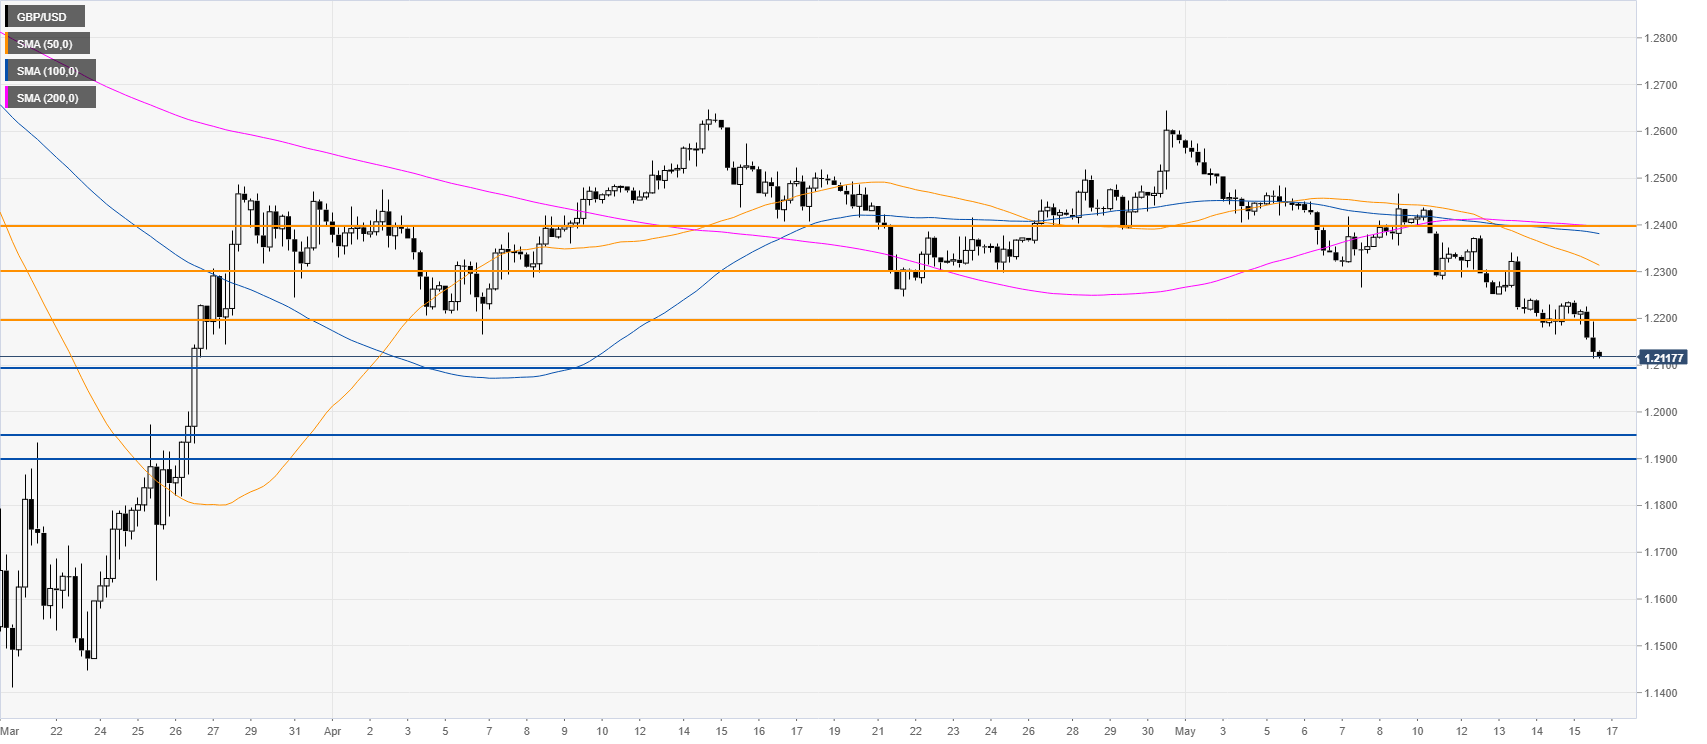
Resistance: 1.2200, 1.2300, 1.2400
Support: 1.2100, 1.1950, 1.1900


Additional key levels

GBP/USD

Overview
Today last price1.2115
Today Daily Change-0.0112
Today Daily Change %-0.92
Today daily open1.2227
 
Trends
Daily SMA201.2388
Daily SMA501.2344
Daily SMA1001.268
Daily SMA2001.2662
 
Levels
Previous Daily High1.2242
Previous Daily Low1.2166
Previous Weekly High1.2504
Previous Weekly Low1.2266
Previous Monthly High1.2648
Previous Monthly Low1.2165
Daily Fibonacci 38.2%1.2195
Daily Fibonacci 61.8%1.2213
Daily Pivot Point S11.2181
Daily Pivot Point S21.2135
Daily Pivot Point S31.2105
Daily Pivot Point R11.2257
Daily Pivot Point R21.2288
Daily Pivot Point R31.2334

Author

Flavio Tosti

Flavio Tosti

Independent Analyst


More from Flavio Tosti
Share:

Editor's Picks

EUR/USD looks apathetic around 1.1770

EUR/USD comes under renewed pressure on Tuesday, deflating below the 1.1800 support and reversing two consecutive days of gains. The pair’s decline follows the persistent move higher in the US Dollar, as trade uncertainty dominates the sentiment ahead of President Trump’s SOTU speech.

GBP/USD regains 1.3500 and above

GBP/USD extends its advance for the third day in a row on Tuesday, this time retesting the area beyond the 1.3500 hurdle. Cable’s uptick comes despite decent gains in the Greenback and the dovish message from the BoE’s Bailey at the UK Parliament.

Gold appears offered around $5,150

Gold is giving back a good portion of the recent multi-day rally, receding to the $5,150 zone per troy ounce amid the decent bounce in the US Dollar and mixed US Treasuty yields. In the meantime, markets’ attention remain on upcoming comments from Fed speakers.

Ripple’s DeFi shift in focus: Navigating XRPL EVM sidechain growth, XRPFi migration and liquidity

Ripple (XRP) has continued to trade under pressure, extending its decline by approximately 63% from the record high of $3.66 in July. The remittance token is trading above support at $1.35, while its upside appears limited by key supply zones, starting with $1.40, at the time of writing on Tuesday.

The Citrini report: How a debatable AI narrative can shake Wall Street

That AI-related headline alone was enough to rattle investors.US stocks slid sharply on Monday after a widely circulated Citrini Research memo outlined a hypothetical “2028 Global Intelligence Crisis”, warning that rapid AI adoption could push US unemployment into double digits as early as by mid-2028.

XRP pressured by weak ETF flows and declining retail interest

Ripple (XRP) is edging lower, trading above its intraday low of $1.32 at the time of writing on Tuesday. The decline from its weekly opening of $1.39 reflects heightened volatility in the broader cryptocurrency market, accentuated by tariff-triggered uncertainty.