|

GBP/USD Price Analysis: Pound remains vulnerable to the downside, trading sub-1.3100 figure

  • GBP/USD bullish breakout from the triangle pattern is currently failing. 
  • The level to beat for bears is the 1.3060 level.
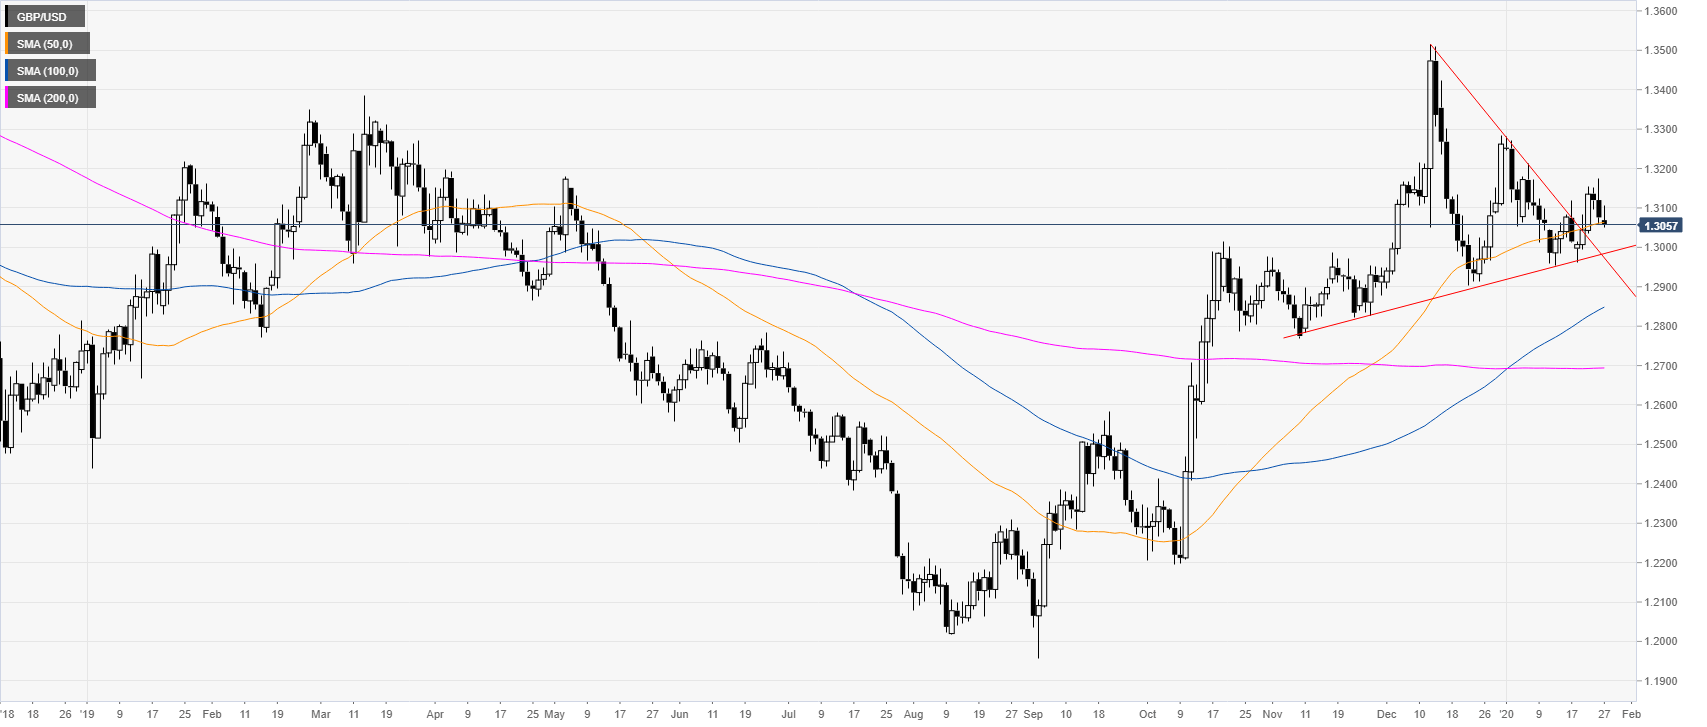
GBP/USD daily chart 

The bullish triangle breakout pattern is currently failing below the 1.3100 figure. The spot is testing the 50-day simple moving average (SMA).  
 

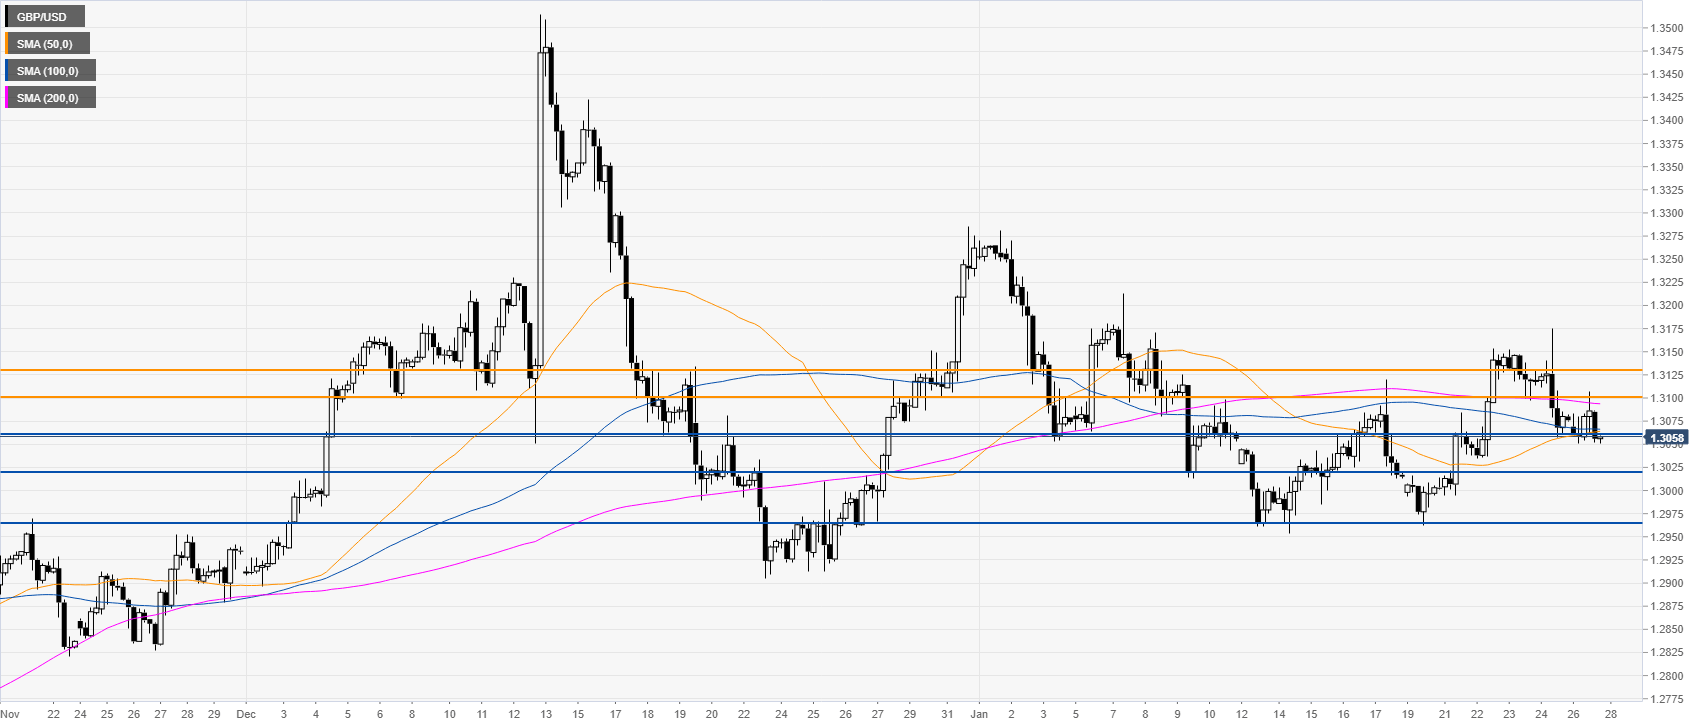
GBP/USD four-hour chart

The pound is weakening below the 1.3100 figure. The market is challenging the 1.3060 support and the 50 and 100 SMAs. A decisive break below this level could lead to a bearish extension towards 1.3019 and 1.2965 support levels, according to the Technical Confluences Indicator.  
  

Additional key levels

GBP/USD

Overview
Today last price1.3057
Today Daily Change-0.0019
Today Daily Change %-0.15
Today daily open1.3076
 
Trends
Daily SMA201.3092
Daily SMA501.3056
Daily SMA1001.2839
Daily SMA2001.2692
 
Levels
Previous Daily High1.3175
Previous Daily Low1.3057
Previous Weekly High1.3175
Previous Weekly Low1.2962
Previous Monthly High1.3515
Previous Monthly Low1.2896
Daily Fibonacci 38.2%1.3102
Daily Fibonacci 61.8%1.313
Daily Pivot Point S11.303
Daily Pivot Point S21.2985
Daily Pivot Point S31.2912
Daily Pivot Point R11.3148
Daily Pivot Point R21.3221
Daily Pivot Point R31.3266

Author

Flavio Tosti

Flavio Tosti

Independent Analyst


More from Flavio Tosti
Share:

Editor's Picks

EUR/USD seems fragile below 1.1700 as Middle East war boosts energy prices

The EUR/USD pair trades flat at around 1.1680 during the Asian trading session on Tuesday, but broadly seems vulnerable, being close to its five-week low. The major currency pair is under pressure as surging oil prices due to the United States-Israel war with Iran have increased the risks of higher inflation for the Old Continent.

GBP/USD hovers around 1.3400 with bearish pressure intact

GBP/USD edges higher after three days of losses, trading around 1.3400 during the Asian hours on Tuesday. The technical analysis of the daily chart indicates an ongoing bearish bias, as the pair trades within a descending channel pattern.

Gold sticks to gains above $5,350 amid sustained safe-haven demand; firmer USD caps gains

Gold sticks to its positive bias for the third straight day and trades above the $5,350 level heading into the European session on Tuesday. Concerns about a broader regional conflict in the Middle East continue to weigh on investors' sentiment and underpin demand for the traditional safe-haven bullion.

Stellar risks deeper losses as derivatives metrics turn negative

Stellar is trading red below $0.16 at the time of writing on Tuesday, after a slight recovery the previous day. Weakening derivatives data caps the recovery, while an unfavorable technical outlook projects a deeper correction for the XLM token in the upcoming days.

The market is not panicking it is repricing the probability distribution of Oil and time

At the end of the day, markets do not trade morality or geopolitics. They trade transmission channels. And the only channel that truly matters in this maelstrom runs through the price of energy and the time value of money.

Hyperliquid Price Forecast: HYPE rises on commodities demand amid US-Iran war

Hyperliquid (HYPE) steadies above $33 at press time on Tuesday, marking its fourth consecutive day of recovery in a broadly volatile market due to the ongoing US-Israel strikes on Iran.