|

GBP/USD Price Analysis: Oscillates in a range below the 1.2500 mark, eyes on UK GDP, US CPI

  • GBP/USD oscillates in the 1.2480-1.2502 region in a trading band.
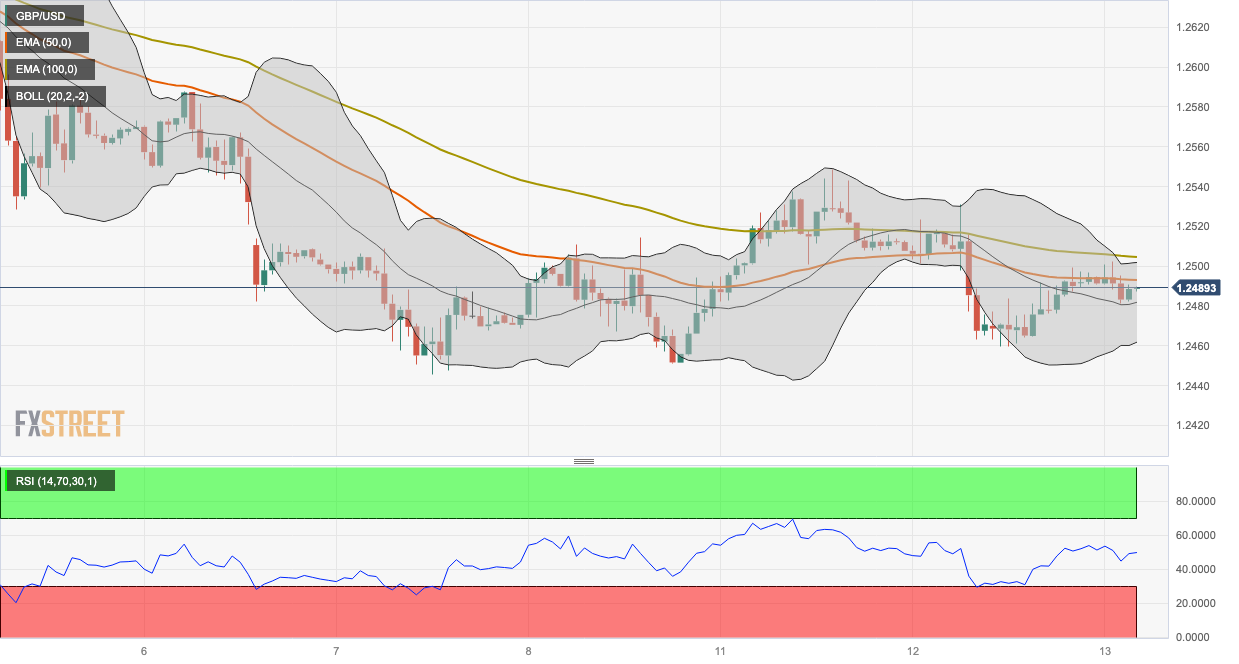
  • The pair holds below the 50- and 100-hour EMAs on the one-hour chart; the RSI stands below 50. 
  • The critical resistance level is seen at the 1.2500-1.2505 zone; 1.2460 acts as an initial support level. 

The GBP/USD pair consolidates in a familiar range below the 1.2500 barrier during the Asian session on Wednesday. The major pair currently trades near 1.2488, losing 0.01% on the day. Market players prefer to wait on the sidelines ahead of the UK Gross Domestic Product (GDP) data for July and the highly anticipated US Consumer Price Index (CPI) data. These figures could trigger the volatility in the pair. 

The Bank of England (BoE) policymaker Catherine Mann remarked on Monday that it was too early for the central bank to pause interest rates and that it was better for the central bank to err on the side of rising rates too high rather than suspending them too soon. The hawkish comments by BoE governors may restrict the British Pound's fall and serve as a tailwind for GBP/USD.

About the data, the UK’s Office for National Statistics reported on Tuesday that the UK Unemployment Rate in the three months to July came in at 4.3% from 4.2% in the previous reading, in line with the market consensus. 

From the technical perspective, GBP/USD holds below the 50- and 100-hour Exponential Moving Averages (EMAs) on the one-hour chart, which means further downside looks favorable. Meanwhile, the Relative Strength Index (RSI) stands below 50, within bearish territory, suggesting that sellers are likely to retain control in the near term.

The critical resistance level for GBP/USD emerges at the 1.2500-1.2505 region, presenting a confluence of the upper boundary of the Bollinger Band, a psychological round figure, and the 100-hour EMA. The additional upside filter is located at 1.2530 (a high of September 12). Further north, 1.2548 will be the next barrier for the pair, followed by a psychological mark at 1.2600. 

On the downside, any follow-through selling below the lower limit of the Bollinger Band and a low of September 12 at 1.2460 will challenge the next contention at 1.2440 (a low of May 12) en route to 1.2390 (a low of June 6) and finally at 1.2350 (a low of May 31).
 

GBP/USD one-hour chart

GBP/USD

Overview
Today last price1.2489
Today Daily Change-0.0001
Today Daily Change %-0.01
Today daily open1.249
 
Trends
Daily SMA201.2624
Daily SMA501.2753
Daily SMA1001.2656
Daily SMA2001.243
 
Levels
Previous Daily High1.2531
Previous Daily Low1.2459
Previous Weekly High1.2643
Previous Weekly Low1.2446
Previous Monthly High1.2841
Previous Monthly Low1.2548
Daily Fibonacci 38.2%1.2487
Daily Fibonacci 61.8%1.2504
Daily Pivot Point S11.2456
Daily Pivot Point S21.2422
Daily Pivot Point S31.2385
Daily Pivot Point R11.2527
Daily Pivot Point R21.2565
Daily Pivot Point R31.2599

Author

Lallalit Srijandorn

Lallalit Srijandorn is a Parisian at heart. She has lived in France since 2019 and now becomes a digital entrepreneur based in Paris and Bangkok.

More from Lallalit Srijandorn
Share:

Markets move fast. We move first.

Orange Juice Newsletter brings you expert driven insights - not headlines. Every day on your inbox.

By subscribing you agree to our Terms and conditions.

Editor's Picks

EUR/USD holds steady near 1.1750 on first trading day of 2026

EUR/USD stays calm on Friday and trades in a narrow channel at around 1.1750 as trading conditions remain thin following the New Year holiday and ahead of the weekend. The economic calendar will not feature any high-impact data releases.

GBP/USD struggles to gain traction, stabilizes above 1.3450

After testing 1.3400 on the last day of 2025, GBP/USD managed to stage a rebound. Nevertheless, the pair finds it difficult to gather momentum and moves sideways above 1.3450 as market participants remain in holiday mood.

Gold climbs toward $4,400 following deep correction

Gold reverses its direction and advances toward $4,400 after suffering heavy losses amid profit-taking before the New Year holiday. Growing expectations for a dovish Fed policy and persistent geopolitical risks seem to be helping XAU/USD stretch higher.

Cardano gains early New Year momentum, bulls target falling wedge breakout

Cardano kicks off the New Year on a positive note and is extending gains, trading above $0.36 at the time of writing on Friday. Improving on-chain and derivatives data point to growing bullish interest, while the technical outlook keeps an upside breakout in focus.

Economic outlook 2026-2027 in advanced countries: Solidity test

After a year marked by global economic resilience and ending on a note of optimism, 2026 looks promising and could be a year of solid economic performance. In our baseline scenario, we expect most of the supportive factors at work in 2025 to continue to play a role in 2026.

Crypto market outlook for 2026

Year 2025 was volatile, as crypto often is.  Among positive catalysts were favourable regulatory changes in the U.S., rise of Digital Asset Treasuries (DAT), adoption of AI and tokenization of Real-World-Assets (RWA).