|

GBP/USD Price Analysis: Hovers around 1.2750 ahead of UK GDP

  • GBP/USD may gain ground as technical analysis suggests a bullish bias for the pair.
  • The momentum indicator MACD suggests confirmation of a bullish trend for the pair.
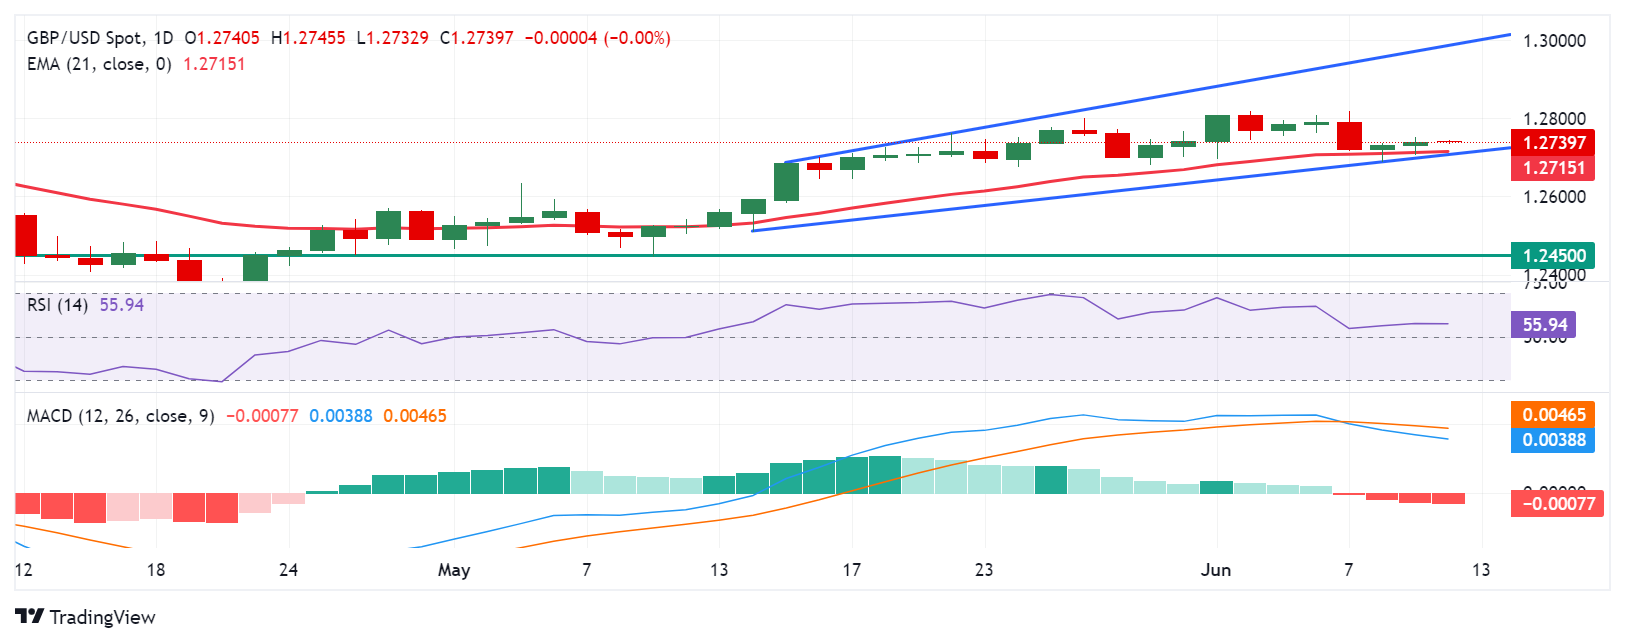
  • The pair may find immediate support at the 21-day EMA at 1.2712, followed by the lower boundary of the ascending channel at 1.2700.

The GBP/USD pair consolidates near 1.2750 during the Asian session on Wednesday. The pair maintains its position within an ascending channel pattern on the daily chart, with the 14-day Relative Strength Index (RSI) above the 50 level, indicating a bullish bias.

Furthermore, the Moving Average Convergence Divergence (MACD) momentum indicator reinforces the bullish trend. The MACD line is above the centerline and diverges above the signal line, suggesting further upward movement.

In terms of resistance, the psychological level of 1.2800 poses a significant barrier. A breakthrough above this level could propel the GBP/USD pair toward testing the upper boundary of the ascending channel around 1.3000.

To the downside, initial support is evident at the 21-day Exponential Moving Average (EMA) situated at 1.2715, with further support lying at the lower boundary of the ascending channel around 1.2700. Should the GBP/USD pair breach this level, it might encounter additional pressure, potentially testing the vicinity of the throwback support at 1.2450.

GBP/USD: Daily Chart

GBP/USD

Overview
Today last price1.274
Today Daily Change0.0000
Today Daily Change %0.00
Today daily open1.274
 
Trends
Daily SMA201.2734
Daily SMA501.2606
Daily SMA1001.2639
Daily SMA2001.2547
 
Levels
Previous Daily High1.2752
Previous Daily Low1.2706
Previous Weekly High1.2818
Previous Weekly Low1.2695
Previous Monthly High1.2801
Previous Monthly Low1.2446
Daily Fibonacci 38.2%1.2734
Daily Fibonacci 61.8%1.2723
Daily Pivot Point S11.2713
Daily Pivot Point S21.2687
Daily Pivot Point S31.2668
Daily Pivot Point R11.2759
Daily Pivot Point R21.2778
Daily Pivot Point R31.2805

Author

Akhtar Faruqui

Akhtar Faruqui is a Forex Analyst based in New Delhi, India. With a keen eye for market trends and a passion for dissecting complex financial dynamics, he is dedicated to delivering accurate and insightful Forex news and analysis.

More from Akhtar Faruqui
Share:

Markets move fast. We move first.

Orange Juice Newsletter brings you expert driven insights - not headlines. Every day on your inbox.

By subscribing you agree to our Terms and conditions.

Editor's Picks

EUR/USD off three-month highs, holds near 1.1800 on softer US Dollar

EUR/USD consolidates gains below 1.1800 in the European trading hours on Wednesday. A broadly subdued US Dollar continues to underpin the pair amid quiet markets and thin liquidity conditions on Christmas Eve. 

GBP/USD keeps range around 1.3500 amid quiet markets

GBP/USD keeps its range trade intact at around 1.3500 in the European session on Wednesday. The Pound Sterling holds the upper hand over the US Dollar amid pre-Christmas light trading as traders turn to sidelines heading into the holiday season. 

Gold retreats from record highs amid profit-taking on Christmas Eve

Gold retreats following the move higher to the $4,525 area, or a fresh all-time peak, though the downside remains limited amid a bullish fundamental backdrop. The US Dollar selling bias remains unabated on the back of dovish Fed expectations, which continues to act as a tailwind for the bullion amid persistent geopolitical risks.

Shiba Inu's bears tighten grip, aiming for yearly lows

Shiba Inu price remains under pressure, trading below $0.000070 on Wednesday as bearish momentum continues to dominate the broader crypto market. On-chain and derivatives data further support the bearish sentiment, while technical analysis suggests a deeper correction targeting the yearly lows.

Economic outlook 2026-2027 in advanced countries: Solidity test

After a year marked by global economic resilience and ending on a note of optimism, 2026 looks promising and could be a year of solid economic performance. In our baseline scenario, we expect most of the supportive factors at work in 2025 to continue to play a role in 2026.

Stellar Price Forecast: XLM slips below $0.22 as bearish momentum builds

Stellar (XLM) price is trading below $0.22 at the time of writing on Wednesday after failing to close above the key resistance earlier this week. Bearish momentum continues to strengthen, with open interest falling and short bets rising.