GBP/USD Price Analysis: Gains traction below 1.2500, investors await BoE’s Bailey speech


  • GBP/USD trades in positive territory for the second consecutive day on the weaker USD.
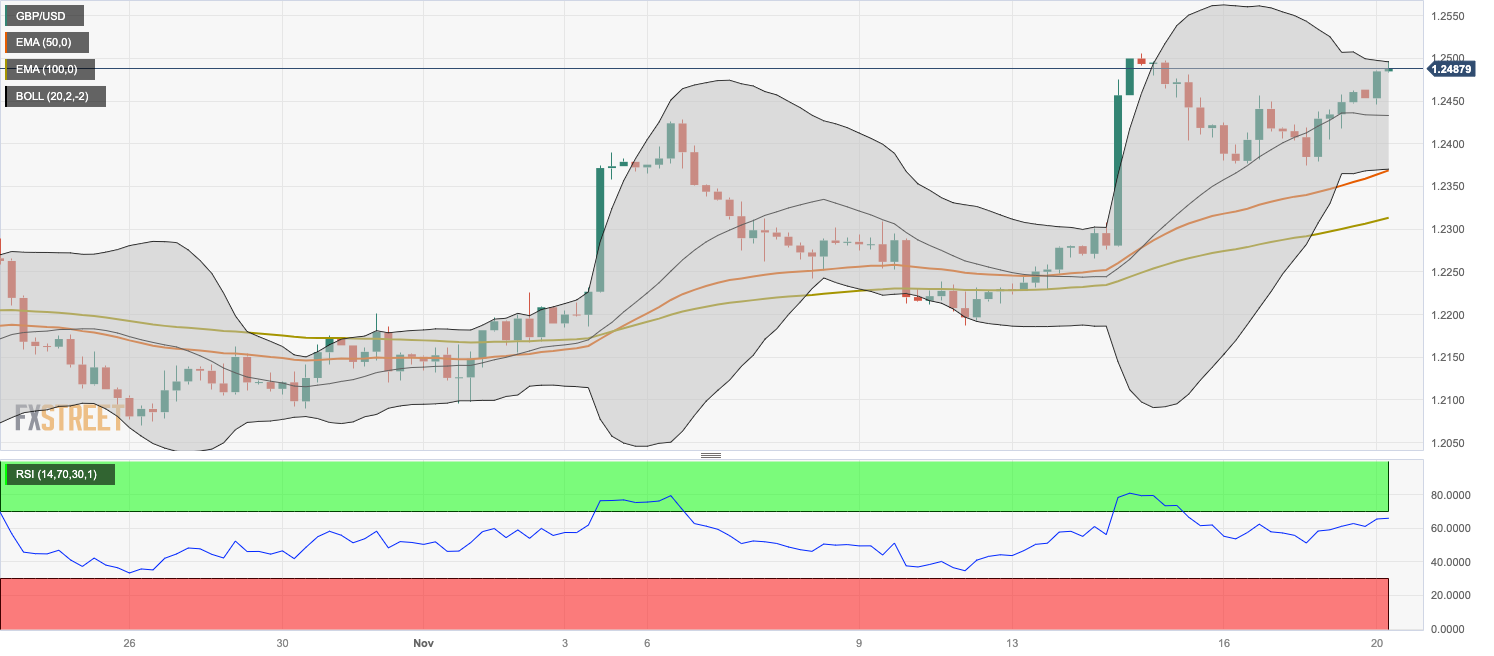
  • The pair holds above the 50- and 100-hour EMA on the four-hour chart, RSI indicator holds in the bullish zone.
  • The key resistance is seen at the 1.2500–1.2505 region; the 1.2370–1.2375 zone acts as a key support level.

The GBP/USD pair holds positive ground around 1.2485 during the early European session on Monday. The recovery of the pair is bolstered by the softer US Dollar (USD) and lower US Treasury bond yields. Investors will take more cues from Bank of England (BoE) Governor Andrew Bailey's speech on Monday ahead of the Federal Open Market Committee (FOMC) Meeting Minutes on Tuesday.

From the technical perspective, GBP/USD holds above the 50- and 100-hour Exponential Moving Averages (EMAs) with an upward slope on the four-hour chart, suggesting the path of least resistance is to the upside. Furthermore, the Relative Strength Index (RSI) holds in the bullish territory above 50, which means further upside looks favorable.

That being said, the critical resistance level for the major pair will emerge near the confluence of the upper boundary of the Bollinger Band and a high of November 14 at the 1.2500–1.2505 region. A decisive break above the latter will see a rally to a high of September 11 at 1.2548. The next upside barrier is seen at a high of September 6 at 1.2588.

On the flip side, the 1.2370–1.2375 zone acts as a key support level. The mentioned level is the congestion of the lower limit of the Bollinger Band, the 50-hour EMA, and a low of November 16. The additional downside filter to watch is the 100-hour EMA at 1.2313. A breach of the level will see a drop to a low of November 8 at 1.2242, followed by a low of November 10 at 1.2187.

GBP/USD four-hour chart


GBP/USD

Overview
Today last price 1.2487
Today Daily Change 0.0026
Today Daily Change % 0.21
Today daily open 1.2461
 
Trends
Daily SMA20 1.2263
Daily SMA50 1.2257
Daily SMA100 1.2509
Daily SMA200 1.2444
 
Levels
Previous Daily High 1.2462
Previous Daily Low 1.2374
Previous Weekly High 1.2506
Previous Weekly Low 1.2213
Previous Monthly High 1.2337
Previous Monthly Low 1.2037
Daily Fibonacci 38.2% 1.2429
Daily Fibonacci 61.8% 1.2408
Daily Pivot Point S1 1.2402
Daily Pivot Point S2 1.2344
Daily Pivot Point S3 1.2314
Daily Pivot Point R1 1.2491
Daily Pivot Point R2 1.2521
Daily Pivot Point R3 1.2579


Share: Feed news

Information on these pages contains forward-looking statements that involve risks and uncertainties. Markets and instruments profiled on this page are for informational purposes only and should not in any way come across as a recommendation to buy or sell in these assets. You should do your own thorough research before making any investment decisions. FXStreet does not in any way guarantee that this information is free from mistakes, errors, or material misstatements. It also does not guarantee that this information is of a timely nature. Investing in Open Markets involves a great deal of risk, including the loss of all or a portion of your investment, as well as emotional distress. All risks, losses and costs associated with investing, including total loss of principal, are your responsibility. The views and opinions expressed in this article are those of the authors and do not necessarily reflect the official policy or position of FXStreet nor its advertisers. The author will not be held responsible for information that is found at the end of links posted on this page.

If not otherwise explicitly mentioned in the body of the article, at the time of writing, the author has no position in any stock mentioned in this article and no business relationship with any company mentioned. The author has not received compensation for writing this article, other than from FXStreet.

FXStreet and the author do not provide personalized recommendations. The author makes no representations as to the accuracy, completeness, or suitability of this information. FXStreet and the author will not be liable for any errors, omissions or any losses, injuries or damages arising from this information and its display or use. Errors and omissions excepted.

The author and FXStreet are not registered investment advisors and nothing in this article is intended to be investment advice.

Recommended content


Recommended content

Editors’ Picks

AUD/USD weakens amid anti-risk flow; bearish USD could limit losses

AUD/USD weakens amid anti-risk flow; bearish USD could limit losses

AUD/USD drifts lower on Friday, although it remains confined within a multi-week-old trading range below the YTD high. Trade-related uncertainties and rising tensions in the Middle East weigh on investors' sentiment and the risk-sensitive Aussie. The downside, however, seems limited amid the USD slump to a multi-year low.

USD/JPY seems vulnerable amid geopolitical risks, BoJ rate hike bets

USD/JPY seems vulnerable amid geopolitical risks, BoJ rate hike bets

USD/JPY prolongs its downtrend for the third straight day on Friday. The global risk sentiment takes a hit amid an escalation of geopolitical tensions in the Middle East, which boosts the JPY's safe-haven status. The USD plummets to a two-year low amid rising Fed rate cut bets and contributes to the decline.

Gold price advances to one-month peak amid a global flight to safety

Gold price advances to one-month peak amid a global flight to safety

Gold price attracts buyers and climbs to over a one-month peak on Friday as rising geopolitical tensions in the Middle East underpin the safe-haven demand. Trade-related uncertainties, rising Fed rate cut bets, and a USD slump to over a two-year low provide an additional boost to the bullion.

Ethereum's new valuation framework tags it 'digital oil,' highlights an $8,000 bull case

Ethereum's new valuation framework tags it 'digital oil,' highlights an $8,000 bull case

Ethereum is down 4% on Thursday following a report targeting institutional investors from Etherealize, a firm that advocates for Ethereum on Wall Street. The report presents a valuation framework comparing ETH to digital oil and predicts a bullish case of $8,000 per ETH in the short term.

US tariffs here to stay, trade deals ‘largely symbolic’

US tariffs here to stay, trade deals ‘largely symbolic’

Despite legal challenges to IEEPA tariffs, US trade policy remains firm. Tariffs on steel and aluminium have doubled, and new sectoral tariffs are expected. Trade deals may emerge, but most will be symbolic. Effective tariff rates will stay high throughout 2025.

The Best brokers to trade EUR/USD

The Best brokers to trade EUR/USD

SPONSORED Discover the top brokers for trading EUR/USD in 2025. Our list features brokers with competitive spreads, fast execution, and powerful platforms. Whether you're a beginner or an expert, find the right partner to navigate the dynamic Forex market.

Forex MAJORS

Cryptocurrencies

Signatures

Best Brokers of 2025