|

GBP/USD Price Analysis: Clings to 100-DMA ahead of UK/US PMIs

  • GBP/USD edges higher following a two-day uptrend to weekly top.
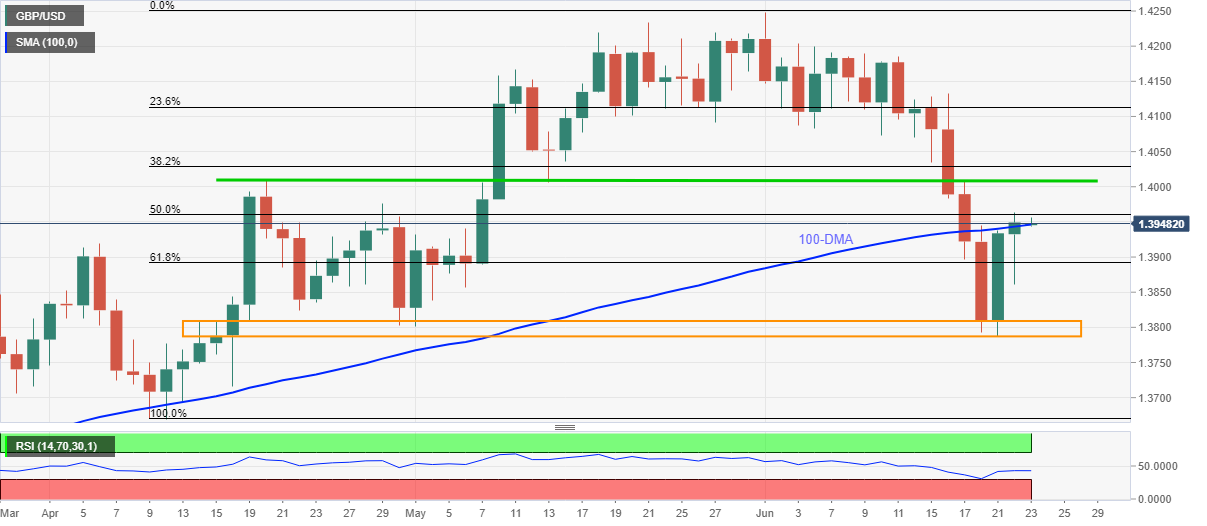
  • 50% Fibonacci retracement guards immediate upside, 10-week-old horizontal area become the key support.
  • Bulls remain hopeful amid upbeat until the quote stays beyond 61.8% Fibonacci retracement.

GBP/USD sellers attack intraday low near 1.3940, keeping choppy moves inside a 10-pips trading range, amid the Asian session on Wednesday. In doing so, the quote seesaws around 100-day SMA after rising for the last two consecutive days.

Considering the cable pair’s sustained trading above 61.8% Fibonacci retracement of April-June upside, amid recovering RSI, the weekly uptrend is likely to prevail, awaiting the monthly PMI data from the US and the UK.

However, the 50% Fibonacci retracement level near 1.3960 tests the intraday buyers ahead of the key horizontal resistance around 1.4005-10.

In a case where the GBP/USD buyers cross the 1.4010 hurdle, the 1.4100 threshold should return to the chart.

Meanwhile, pullback moves may aim for 61.8% Fibonacci retracement close to 1.3890 before eyeing the April 22 low near 1.3820. Though, any further declines will be challenged by the 1.3810–3790 region comprising multiple levels marked since mid-April.

Overall, GBP/USD remains in the recovery mode but bulls need fresh fuel to extend the run-up, which in turn emphasize on today’s activity numbers.

GBP/USD daily chart

Trend: Bullish

additional important levels

Overview
Today last price1.3949
Today Daily Change4 pips
Today Daily Change %0.03%
Today daily open1.3945
 
Trends
Daily SMA201.4092
Daily SMA501.4029
Daily SMA1001.3943
Daily SMA2001.3609
 
Levels
Previous Daily High1.3964
Previous Daily Low1.386
Previous Weekly High1.4133
Previous Weekly Low1.3792
Previous Monthly High1.4234
Previous Monthly Low1.3801
Daily Fibonacci 38.2%1.3924
Daily Fibonacci 61.8%1.39
Daily Pivot Point S11.3883
Daily Pivot Point S21.382
Daily Pivot Point S31.3779
Daily Pivot Point R11.3986
Daily Pivot Point R21.4026
Daily Pivot Point R31.4089

Author

Anil Panchal

Anil Panchal

FXStreet

Anil Panchal has nearly 15 years of experience in tracking financial markets. With a keen interest in macroeconomics, Anil aptly tracks global news/updates and stays well-informed about the global financial moves and their implications.

More from Anil Panchal
Share:

Editor's Picks

AUD/USD falls to near 0.7100 after slipping below 50-day EMA

AUD/USD depreciates after registering minor gains in the previous day, trading around 0.7120 during the Asian hours. The technical analysis of the daily chart shows the pair consolidating sideways within a rectangle pattern, as neither bulls nor bears gain control. The AUD/USD pair is holding a slight bearish tone however as it sits beneath both the nine-day and 50-day EMAs.

160.00: USD/JPY back near intervention territory after upbeat US jobs report

US Nonfarm Payrolls beat expectations by a wide margin in May, with 172K jobs added. The US Dollar rebounds after the release, helping USD/JPY recover from its intraday lows. Warnings from Japanese authorities continue to limit upside potential near the 160.00 threshold.

Gold targets $4,300 amid stronger Dollar

Gold faces increasing selling interest and navigates the area of three-month lows near the $4,300 mark per troy ounce on Friday. The precious metal’s decline comes as traders assess the stronger-than-expected NFP, while the bid bias in the Greenback and higher US Treasury yields also collaborate with the retracement.

Cardano hits five-year low even as Hoskinson clarifies "break" isn't an exit

Cardano (ADA) price is down 10% at press time on Friday, extending losses over 30% so far this week amid Charles Hoskinson's clarification that "break" isn't an exit.

Week ahead – Fed countdown begins amid US inflation data and geopolitical risks

Fed Chair Warsh’s first meeting approaches as key US inflation data could reshape expectations. Oil prices remain elevated as US-Iran talks continue; tariffs also return to the spotlight. ECB is expected to hike; will it be a one-off move or is July live?

The US economy defies the rules: 100 days into the Oil shock and the recession signal is still missing

More than three months after the start of the Iran war and the resulting disruption to global energy markets, the US economy continues to display remarkable resilience. The conflict has triggered a sharp rise in Oil prices, reignited inflationary pressures and fueled widespread concerns about a potential economic slowdown.