|

GBP/USD Price Analysis: Bears attack 1.2100 with eyes on yearly low, key UK/US data

  • GBP/USD remains pressured around two-week low, prints four-day downtrend.
  • Clear downside break of seven-week-old horizontal area joins bearish MACD signals, downbeat RSI to favor sellers.
  • Bulls to remain skeptical unless crossing monthly resistance line.

GBP/USD struggles around a fortnight low while defending 1.2100 during Thursday’s Asian session. In doing so, the Cable pair portrays the mixed sentiment of traders ahead of the UK Gross Domestic Product (GDP) and the Fed’s preferred inflation gauge, namely the Core Personal Consumption Expenditure (PCE) Price Index.

Despite the recent corrective pullback, the quote maintains the previous day’s downside break of a horizontal support since May 12, now resistance around 1.2155-70. Also keeping the pair sellers hopeful area the bearish signals from the MACD and the RSI (14).

That said, the 23.6% Fibonacci retracement (Fibo.) of May-June fall, around 1.2100, challenge the quote’s immediate downside ahead of the 1.2000 psychological magnet.

Following that, the GBP/USD south-run could aim for the yearly low of 1.1933 before declining further.

Alternatively, recovery remains elusive until the quote stays below 1.2170, a break of which could direct the pair towards the 38.2% Fibonacci retracement level of 1.2215.

It should be noted, however, that the confluence of the 20-DMA, fortnight-old resistance line and 50% Fibonacci retracement appears a tough nut to crack for GBP/USD bulls around 1.2300.

GBP/USD: Daily chart
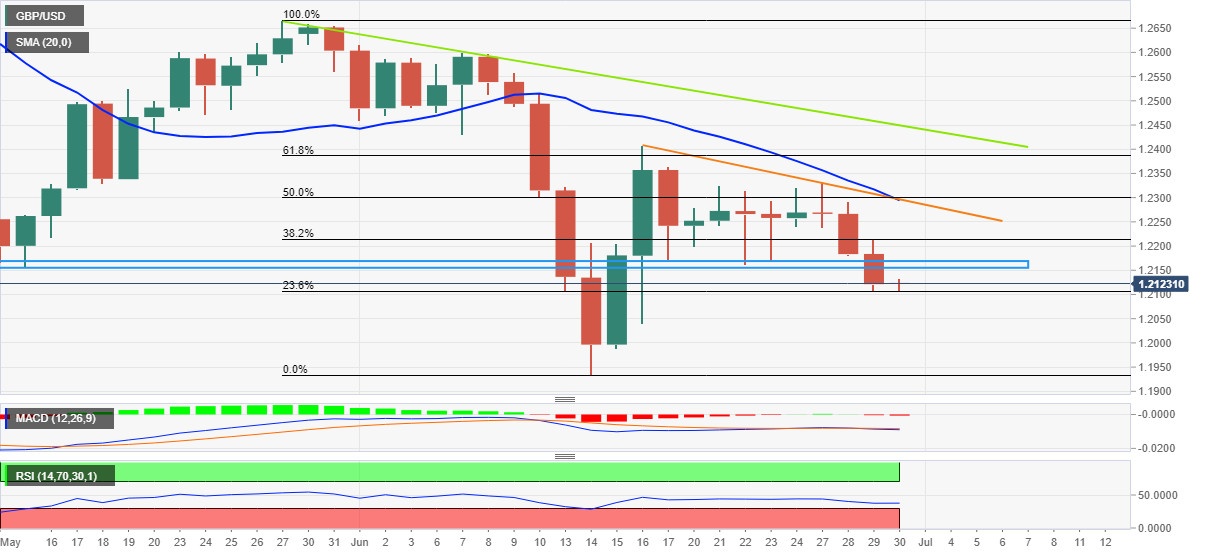
Trend: Bearish

Additional important levels

Overview
Today last price1.2118
Today Daily Change-0.0003
Today Daily Change %-0.02%
Today daily open1.2121
 
Trends
Daily SMA201.2317
Daily SMA501.2431
Daily SMA1001.2831
Daily SMA2001.317
 
Levels
Previous Daily High1.2213
Previous Daily Low1.2106
Previous Weekly High1.2324
Previous Weekly Low1.2161
Previous Monthly High1.2667
Previous Monthly Low1.2155
Daily Fibonacci 38.2%1.2147
Daily Fibonacci 61.8%1.2172
Daily Pivot Point S11.208
Daily Pivot Point S21.2039
Daily Pivot Point S31.1973
Daily Pivot Point R11.2188
Daily Pivot Point R21.2254
Daily Pivot Point R31.2295

Author

Anil Panchal

Anil Panchal

FXStreet

Anil Panchal has nearly 15 years of experience in tracking financial markets. With a keen interest in macroeconomics, Anil aptly tracks global news/updates and stays well-informed about the global financial moves and their implications.

More from Anil Panchal
Share:

Editor's Picks

EUR/USD revisits 1.1780, or daily lows

EUR/USD now comes under further selling pressure, breaking below the 1.1800 support to reach daily troughs on Thursday. The pair’s decline comes in response to a sudden bout of USD strength amid steady geopolitical tensions. Ealier in the day, the ECB’s Lagarde delivered cautious remarks, although the currency remained apathetic.

GBP/USD makes a U-turn, challenges 1.3500

GBP/USD rapidly leaves behind Wednesday’s strong advance, putting the 1.3500 support to the test on Thursday. Cable’s deep pullback follows the strong gains in the Greenback, while investors continue to pencil in a potential BoE rate cut in March.

Gold clings to gains just below $5,200, focus on geopolitics

Gold is edging modestly higher on Thursday, adding to Wednesday’s uptick and holding just below the $5,200 mark per troy ounce against the backdrop of modest gains in the US Dollar. In the meantime, attention is turning to the geopolitical scenario following US-Iran nuclear talks.

Stellar: Relief bounce fades as bearish undertone persists

Stellar is trading around $0.16 at the time of writing on Thursday after rebounding more than 8% in the previous day. Derivatives data paints a negative picture as XLM’s short bets hit a monthly high while Open Interest continues to decline.

The one thing everyone is on the lookout for is US action of some sort against Iran

The FX market is minestrone soup these days. It is befuddled by conflicting data, rumors and small stories exaggerated out of proportion, and Trump-generated uncertainty. 

Bitcoin steadies as traders eye US–Iran talks

Bitcoin (BTC) price is stabilizing around $68,000 at the time of writing on Thursday after a 6.2% relief rally the previous day amid a broader downward trend.