GBP/USD catches a bullish bounce after US ISM PMI miss sparks risk appetite
- GBP/USD rallies back into technical midrange near 1.2650.
- Broad-market risk appetite knocks Greenback lower.
- US ISM Manufacturing PMI fell back in February, price pressures easing.

GBP/USD caught an intraday bump on Friday after a surprise miss in the US ISM Manufacturing Purchasing Managers Index (PMI) sparked renewed risk appetite on the back of fresh hopes for easing inflation to kick off a round of rate cuts from the Federal Reserve (Fed).
ISM Manufacturing PMI: declines to 47.8 in February vs. 49.5 expected
The US ISM Manufacturing PMI for February slid to 47.8 versus the forecast uptick to 49.5 from the previous month's 49.1. Easing PMI sentiment is helping to bolster renewed hopes for rate cuts from the Fed, with rate trim expectations further bolstered by the Fed's latest Monetary Policy Report, wherein the Fed reaffirmed its stance that inflation is back on its way to the top of the 2% target band.
Fed's MPR: Inflation expectations are broadly consistent with 2% goal
This week and next week both see a thin showing in economic figures from the UK to drive the Pound Sterling, but traders will be pivoting to face next week's hefty labor data from the US. Next Tuesday sees the Services component of the ISM PMI figures, followed by the ADP Employment Change preview for February on Wednesday, and next week will close with a bang with the latest US Nonfarm Payrolls (NFP) print.
GBP/USD technical outlook
GBP/USD caught a ride on Monday, bumping back into the 200-hour Simple Moving Average (SMA) near 1.2650 after falling to a near-term low at the 1.2600 handle. Near-term technical momentum has been flat to bearish in the pair, and Thursday's peak just above 1.2680 remains a key technical ceiling for bullish momentum.
GBP/USD struggled to push over 1.2700 this week, getting rejected from the key handle multiple times before falling back to familiar technical levels. Bullish support is still priced in from the 200-day SMA near 1.2576.
GBP/USD hourly chart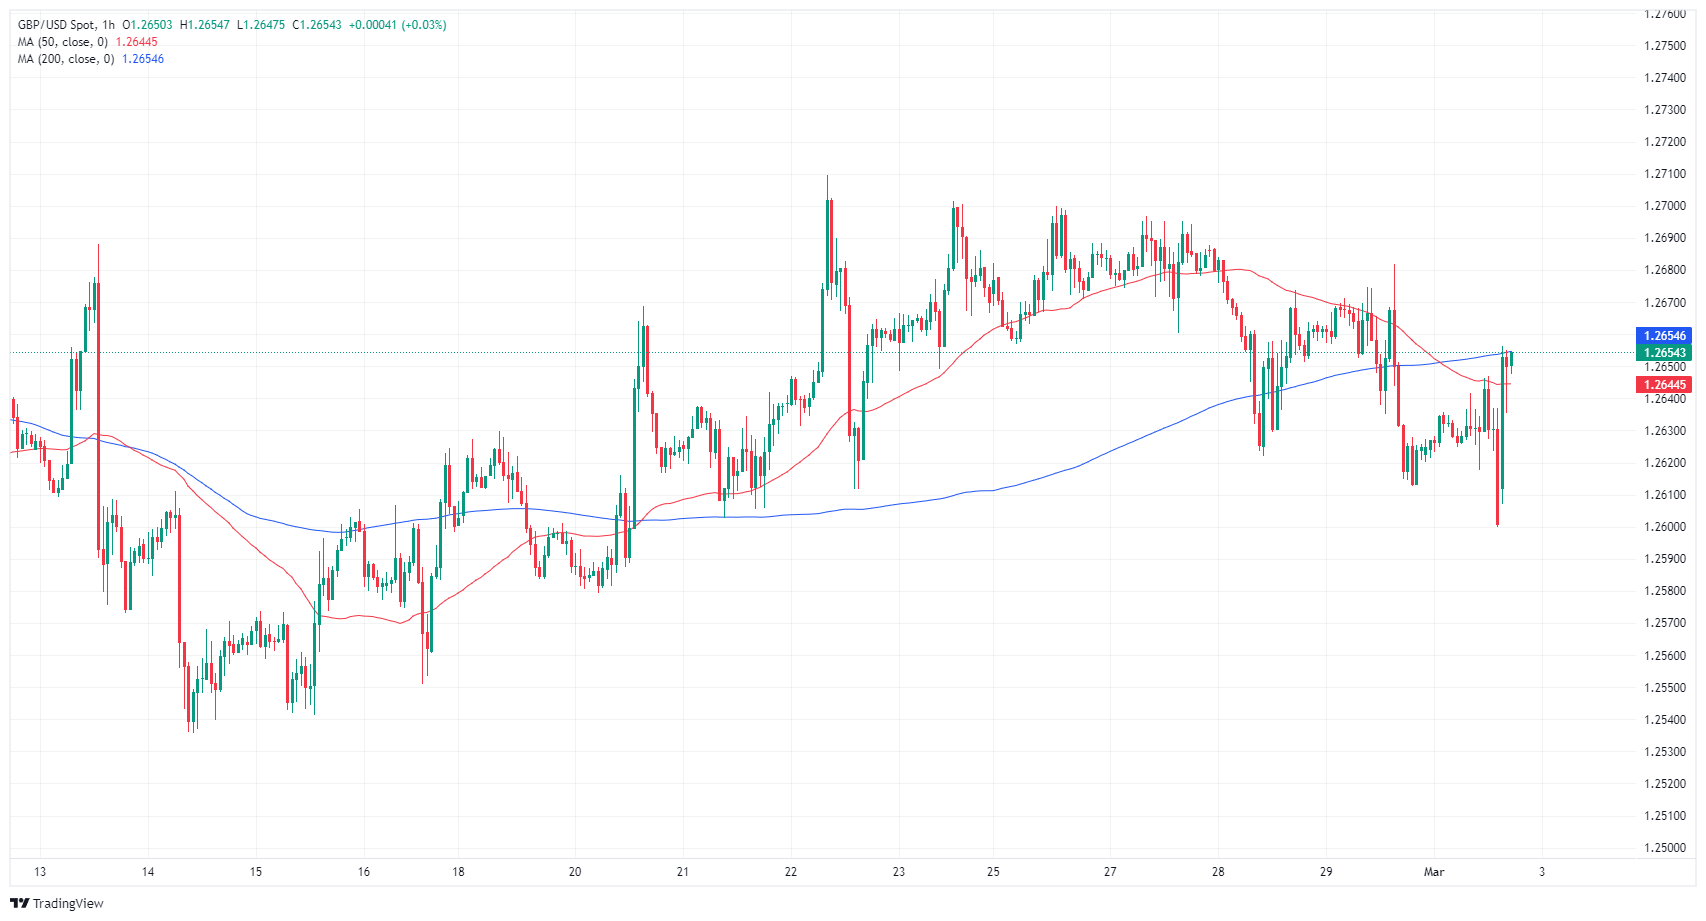
GBP/USD daily chart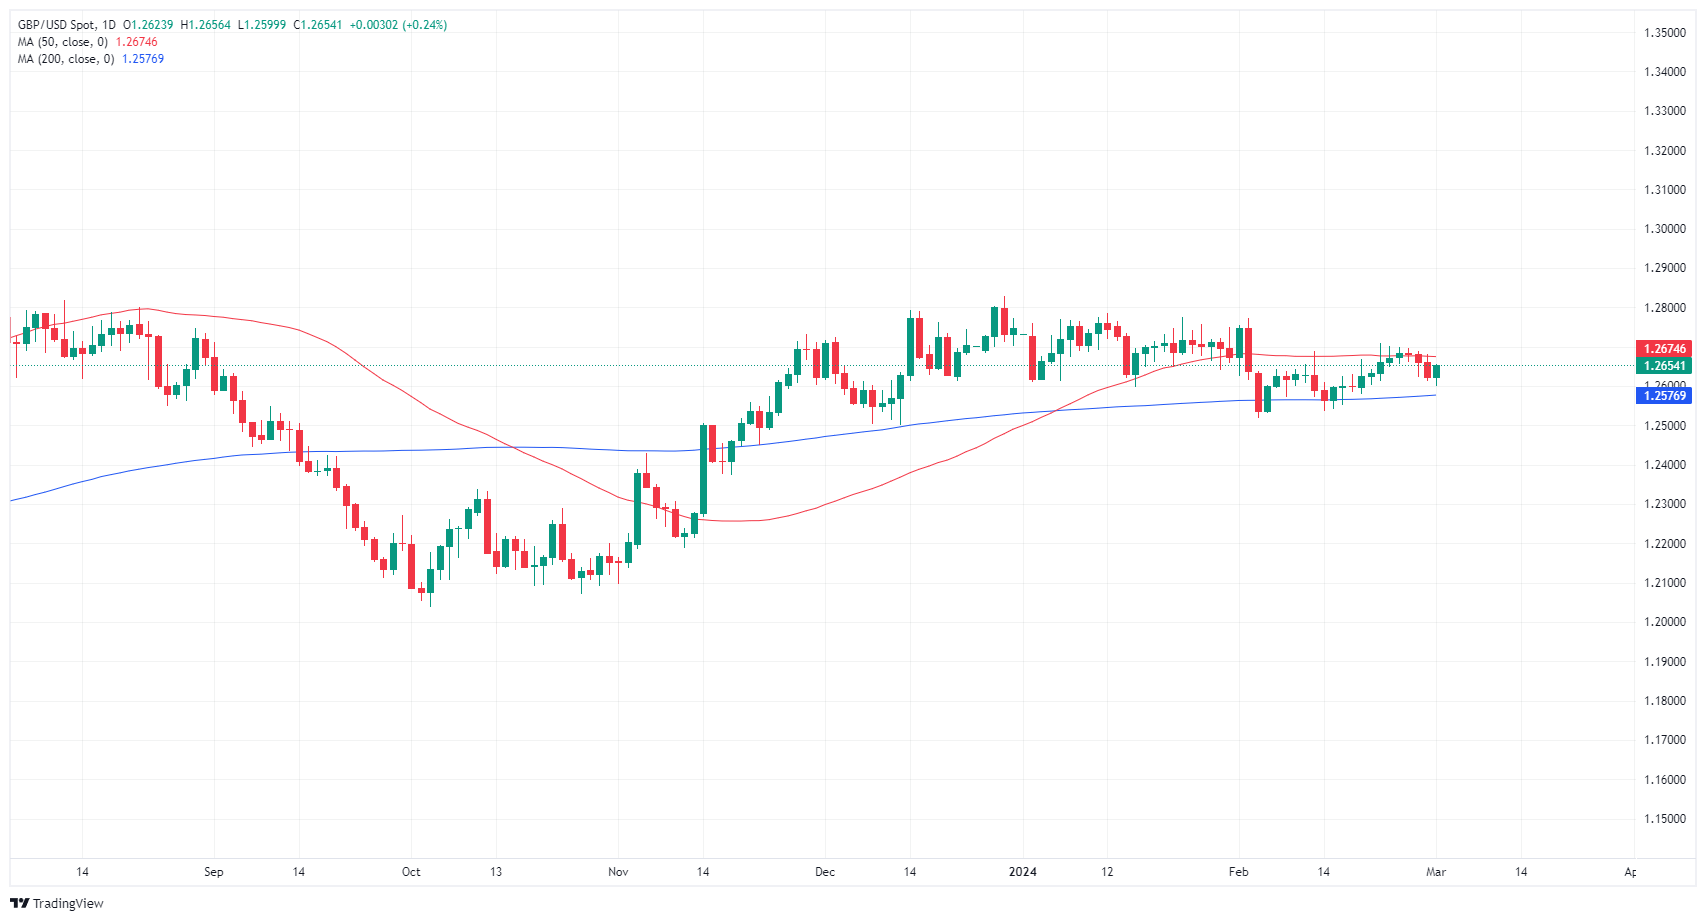
Author

Joshua Gibson
FXStreet
Joshua joins the FXStreet team as an Economics and Finance double major from Vancouver Island University with twelve years' experience as an independent trader focusing on technical analysis.