|
GBP/USD Asia Price Forecast: Pound off 2020 lows, trades near 1.2950 level
- GBP/USD is reversing from 2020 lows as the market printed a descending wedge.
- The levels to beat for bulls is the 1.2995 level.

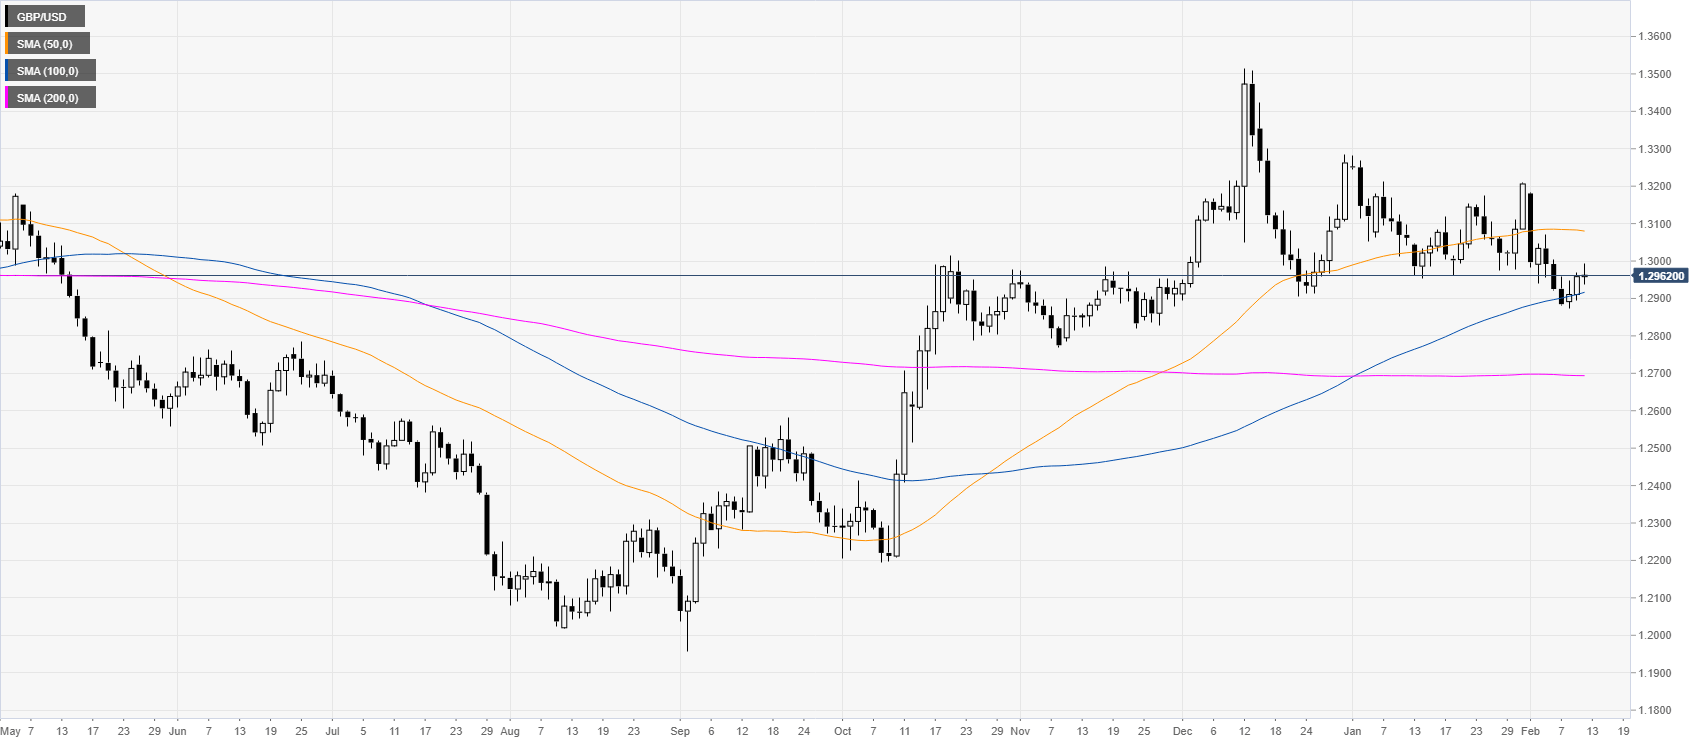
GBP/USD daily chart
After the October and December bull-market, the pound is trading in a rectangle consolidation above its 100/200-day simple moving averages (SMAs).
GBP/USD four-hour chart
The pound is retracing back up after the market printed a descending wedge pattern. Bulls could try to defend the 1.2954 and 1.2914 support levels as the market is regaining some bullish momentum. However, buyers should try to beat the 1.2995 level in order to reach the 1.3035 and 1.3089 on the way up, according to the Technical Confluences Indicator.
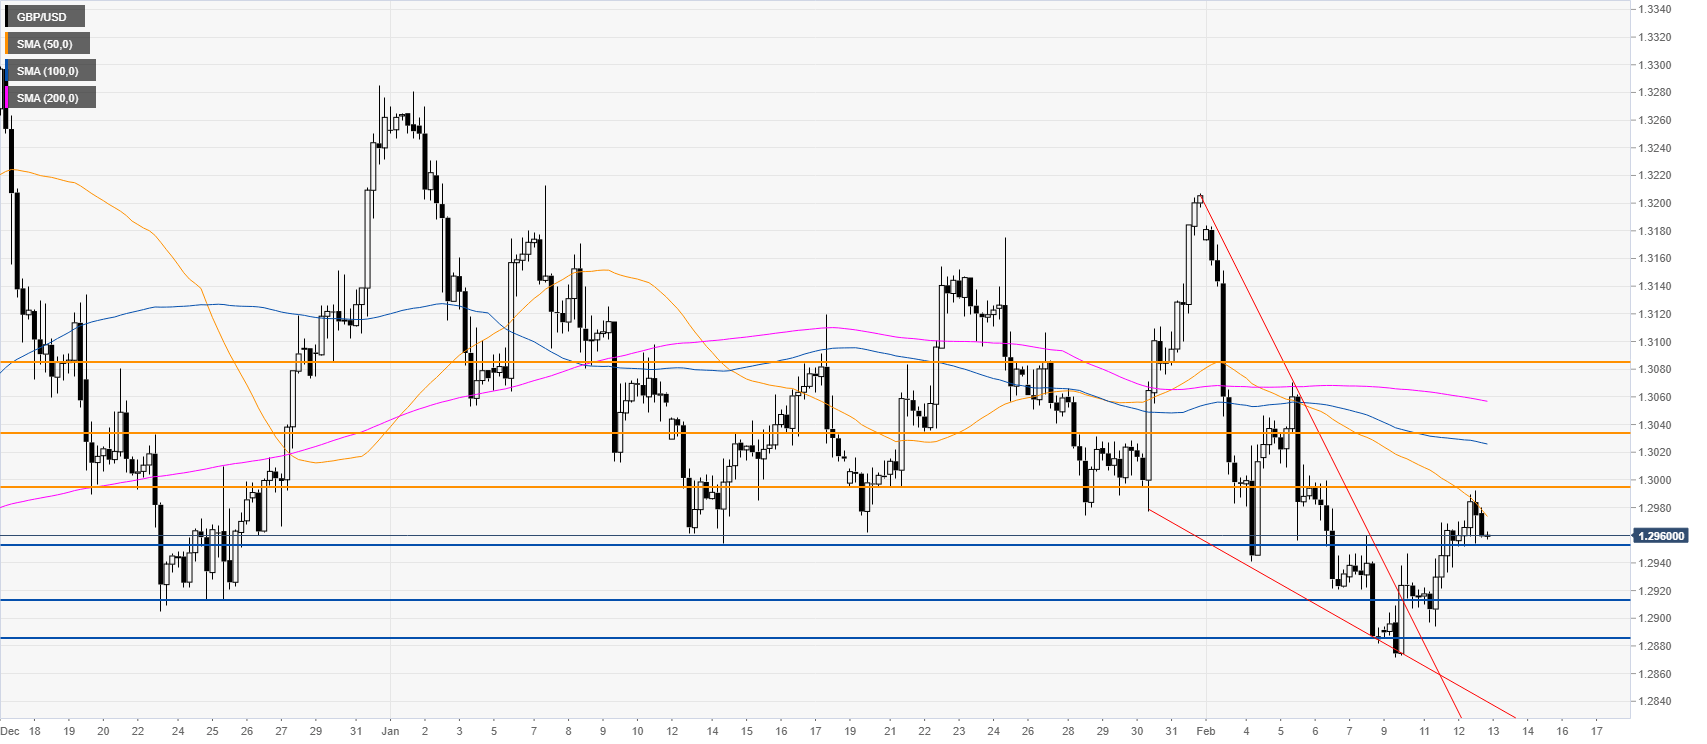
Resistance: 1.2995, 1.3035, 1.3089
Support: 1.2954, 1.2914, 1.2887
Additional key levels
Author

Flavio Tosti
Independent Analyst
More from Flavio Tosti


