|

GBP/JPY Technical Analysis: Sterling sub-145.00 against Yen as Brexit saga goes on
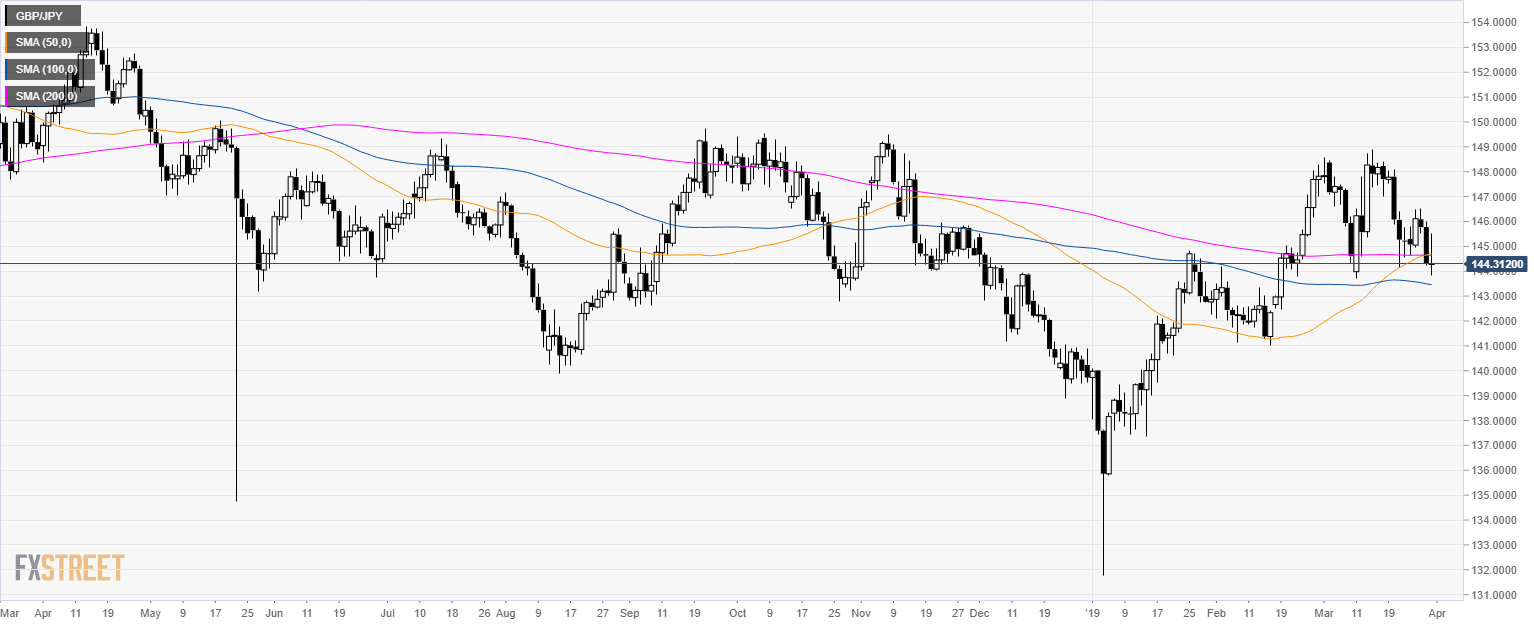
GBP/JPY daily chart

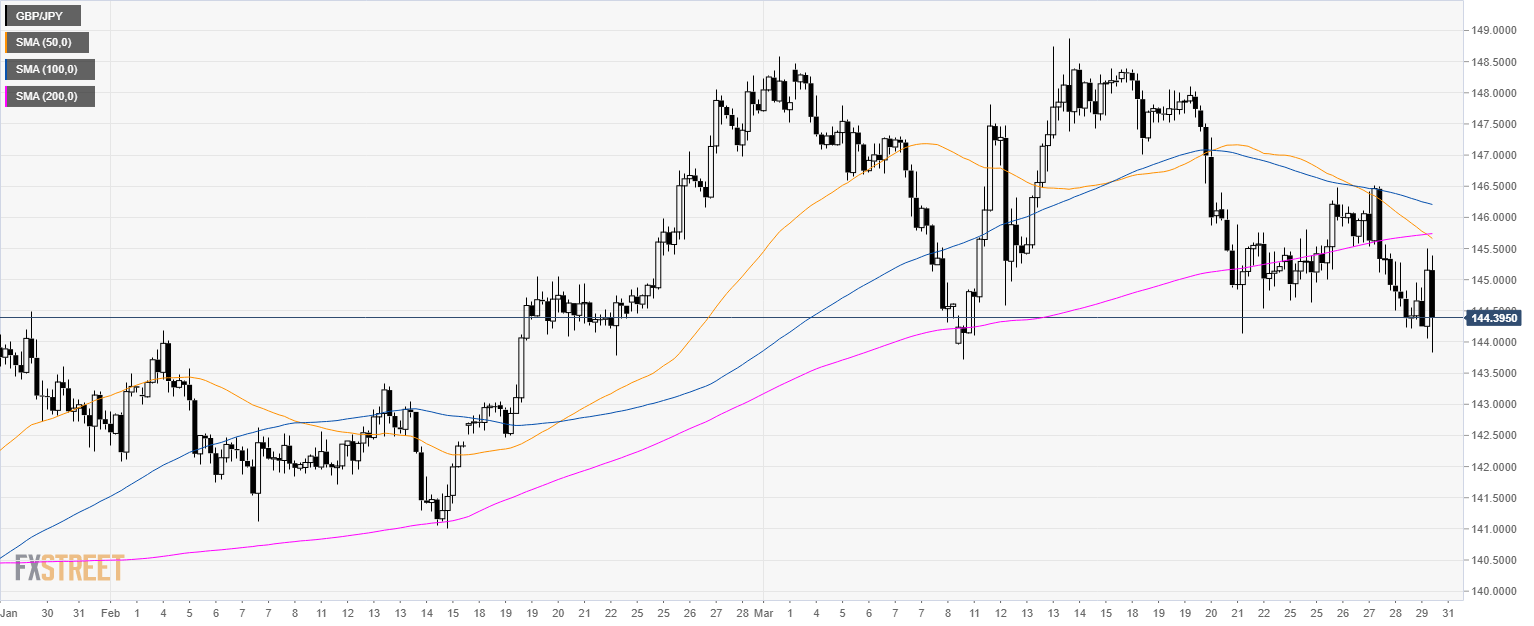
GBP/JPY 4-hour chart

  • GBP/JPY is trading below its 200 SMA suggesting a bearish bias in the medium-term.

GBP/JPY 30-minute chart
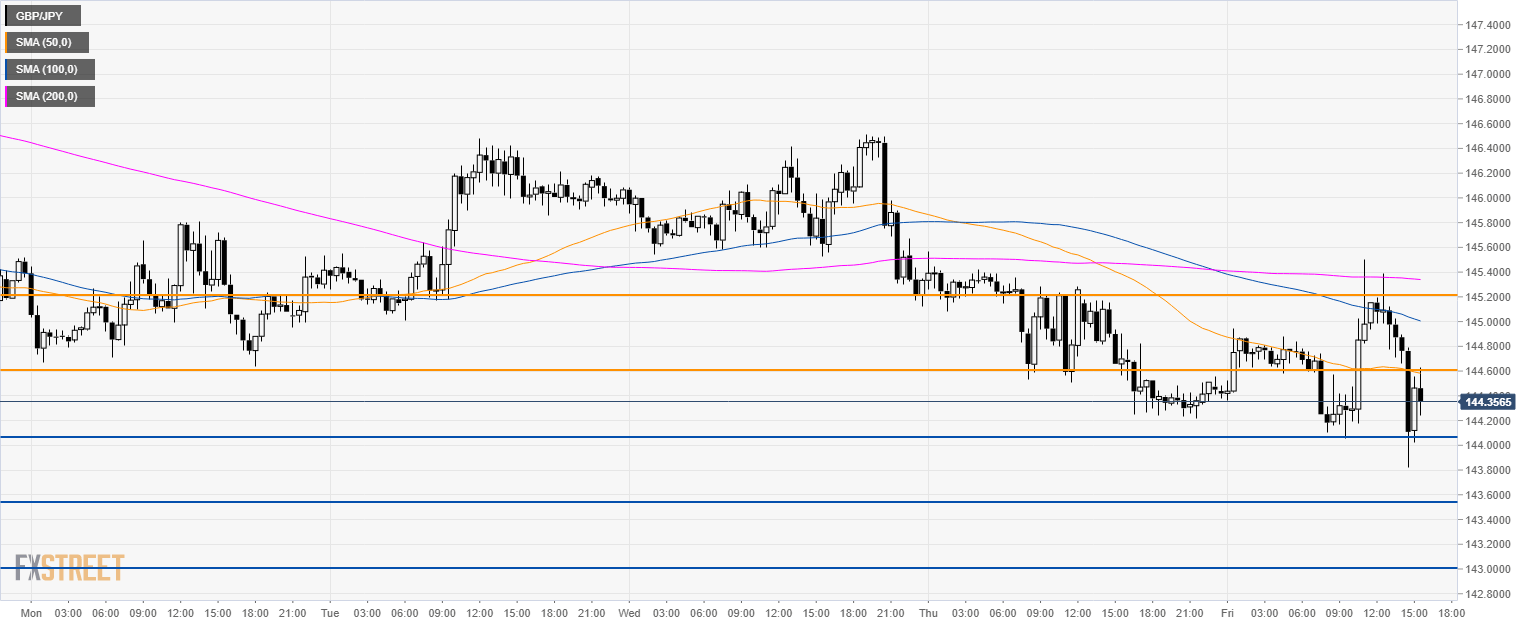
  • GBP/JPY is trading below its main SMAs suggesting a bearish bias in the short-term.
  • On the way down, the next supports are 144.05 and 143.50 level.
  • Resistance is at 144.60 and 145.20 level.

Additional key levels

GBP/JPY

Overview
Today last price144.2
Today Daily Change-0.10
Today Daily Change %-0.07
Today daily open144.3
 
Trends
Daily SMA20146.49
Daily SMA50144.65
Daily SMA100143.49
Daily SMA200144.64
 
Levels
Previous Daily High145.98
Previous Daily Low144.23
Previous Weekly High148.39
Previous Weekly Low144.13
Previous Monthly High148.28
Previous Monthly Low141.01
Daily Fibonacci 38.2%144.9
Daily Fibonacci 61.8%145.31
Daily Pivot Point S1143.69
Daily Pivot Point S2143.09
Daily Pivot Point S3141.94
Daily Pivot Point R1145.44
Daily Pivot Point R2146.59
Daily Pivot Point R3147.19

Author

Flavio Tosti

Flavio Tosti

Independent Analyst


More from Flavio Tosti
Share:

Editor's Picks

EUR/USD eyes nine-day EMA barrier after rebounding from 1.1600

EUR/USD gains ground after registering modest losses in the previous session, trading around 1.1620 during the Asian hours on Friday. The technical analysis of the daily chart suggests an ongoing bearish bias as the pair remains within the descending channel pattern.

GBP/USD: Pound Sterling ticks up against US Dollar in countdown to US NFP

The Pound Sterling trades marginally higher to near 1.3365 against the US Dollar during the Asian trading session on Friday. The GBP/USD pair edges up as the US Dollar ticks down ahead of the United States Nonfarm Payrolls data for February, which will be published at 13:30 GMT.

Gold rises but remains on track for weekly loss in five weeks

Gold price recovers its recent losses from the previous session on Friday. The yellow metal advances as the broader precious metals market rebounds on safe-haven demand. However, the yellow metal is on track for its first weekly decline in five weeks as escalating Middle East tensions push oil prices higher, fueling inflation concerns and reducing bets on Federal Reserve rate cuts.

Bitcoin, Ethereum and Ripple at risk as US-Iran war extends

Bitcoin, Ethereum, and Ripple trade cautiously at press time on Friday, close to key support levels after a roughly 2% pullback the previous day. Bitcoin holds above $71,000, Ethereum at $2,000, and XRP continues to consolidate in a sideways range.

The market compass is pointing at a barrel of Oil

The Asian open is arriving with equities leaning the wrong way, and the reason is not complicated. The market’s compass needle has snapped firmly toward crude. In this tape, oil is not just another input price; it is the gravitational center around which every asset class is orbiting.

Top 3 Price Prediction: Bitcoin, Ethereum, Ripple at risk as US-Iran war extends

Bitcoin, Ethereum, and Ripple trade cautiously at press time on Friday, close to key support levels after a roughly 2% pullback the previous day. Bitcoin holds above $71,000, Ethereum at $2,000, and XRP continues to consolidate in a sideways range.