GBP/JPY Price Forecast: Failed breakout puts 208.00 in focus
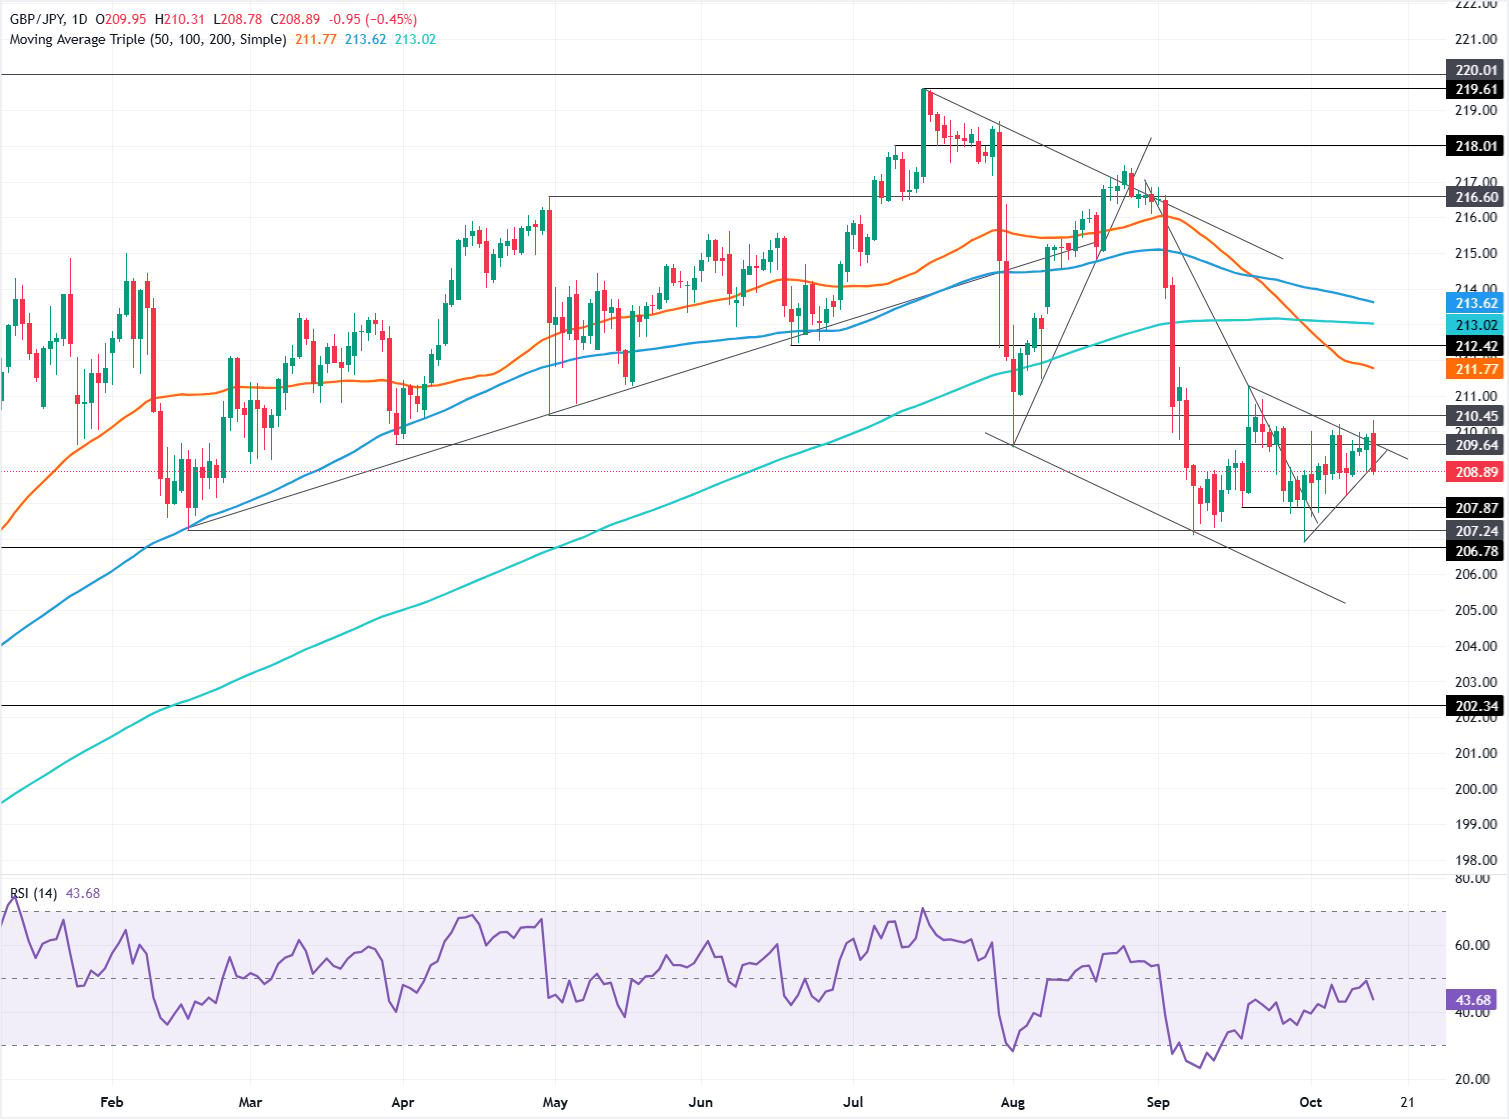
- GBP/JPY rejects 210.31, reversing its earlier descending trendline breakout.
- RSI remains bearish as fading momentum favors further downside.
- Break below 208.50 exposes 208.20, 208.00 and 206.89 next.

The GBP/JPY dives over 0.45% on Wednesday as market mood turns sour on red-hot US inflation data, which drove US equities lower and fueled speculation that major central banks would need to tighten monetary policy. The cross-pair exchanges hands at 208.89, after reaching a high of 210.31.
GBP/JPY Price Forecast: Technical outlook
Earlier, the GBP/JPY cleared a downward resistance trendline and hit the day’s high, ahead of the release of US CPI data. Once released, the Pound weakened and the Yen, benefiting from its safe-haven appeal, pushed the pair below 209.00 toward current spot prices.
The Relative Strength Index (RSI) shows that bullish momentum has somewhat faded, though it remains bearish-biased, suggesting further downside.
The GBP/JPY first support is 208.50. A breach of the latter will expose the October 8 low of 208.20, followed by 208.00. Once cleared, the next stop is the year-to-date (YTD) low of 206.89, ahead of the December 16 cycle low of 206.78
For a bullish reversal, traders must first drive the spot price above 209.00, followed by the high of the day (HOD) at 210.31. If achieved, the September 18 high of 211.28 sits above, which, once surpassed, paves the way for buyers to challenge the 50-day Simple Moving Average (SMA) at 214.43.
GBP/JPY Price Chart – Daily
Pound Sterling Price Today
The table below shows the percentage change of British Pound (GBP) against listed major currencies today. British Pound was the strongest against the Euro.
| USD | EUR | GBP | JPY | CAD | AUD | NZD | CHF | |
|---|---|---|---|---|---|---|---|---|
| USD | 0.41% | 0.50% | 0.02% | 0.13% | 0.18% | 0.32% | 0.31% | |
| EUR | -0.41% | 0.10% | -0.41% | -0.28% | -0.24% | -0.10% | -0.10% | |
| GBP | -0.50% | -0.10% | -0.50% | -0.39% | -0.33% | -0.19% | -0.20% | |
| JPY | -0.02% | 0.41% | 0.50% | 0.15% | 0.15% | 0.38% | 0.28% | |
| CAD | -0.13% | 0.28% | 0.39% | -0.15% | 0.04% | 0.20% | 0.21% | |
| AUD | -0.18% | 0.24% | 0.33% | -0.15% | -0.04% | 0.13% | 0.10% | |
| NZD | -0.32% | 0.10% | 0.19% | -0.38% | -0.20% | -0.13% | 0.01% | |
| CHF | -0.31% | 0.10% | 0.20% | -0.28% | -0.21% | -0.10% | -0.01% |
The heat map shows percentage changes of major currencies against each other. The base currency is picked from the left column, while the quote currency is picked from the top row. For example, if you pick the British Pound from the left column and move along the horizontal line to the US Dollar, the percentage change displayed in the box will represent GBP (base)/USD (quote).
Author

Christian Borjon Valencia
FXStreet
Markets analyst, news editor, and trading instructor with over 14 years of experience across FX, commodities, US equity indices, and global macro markets.