GBP/JPY Price Forecast: Bulls test 214.50 resistance as upside momentum improves
- GBP/JPY trades with a positive bias as improving US-Iran deal optimism boosts market sentiment.
- Falling Oil prices ease inflation concerns, though elevated Energy costs continue to pressure the Japanese Yen.
- Technically, GBP/JPY maintains a constructive bullish tone while holding above key long-term moving averages.

GBP/JPY trades with a positive bias on Monday as the British Pound (GBP) outperforms the Japanese Yen (JPY) amid improving market sentiment surrounding a potential US-Iran deal. At the time of writing, the cross is trading around 214.52, up 0.30% on the day.
Optimism over a possible breakthrough in negotiations between the United States (US) and Iran improved risk appetite after reports suggested both sides were making progress toward a temporary agreement that could eventually reopen the Strait of Hormuz.
However, a report from The Wall Street Journal on Monday suggested negotiations continue to face hurdles over disagreements tied to Iran’s nuclear program and sanctions relief. While key issues remain unresolved, ongoing diplomatic efforts continue to support cautious optimism in markets.
The latest headlines drag Oil prices lower, easing fears of an Oil-driven inflation shock. Still, prices remain well above pre-war levels, leaving the Japanese Yen under pressure as elevated Energy costs continue to pose a key challenge for Japan’s import-dependent economy.
Technical Analysis:
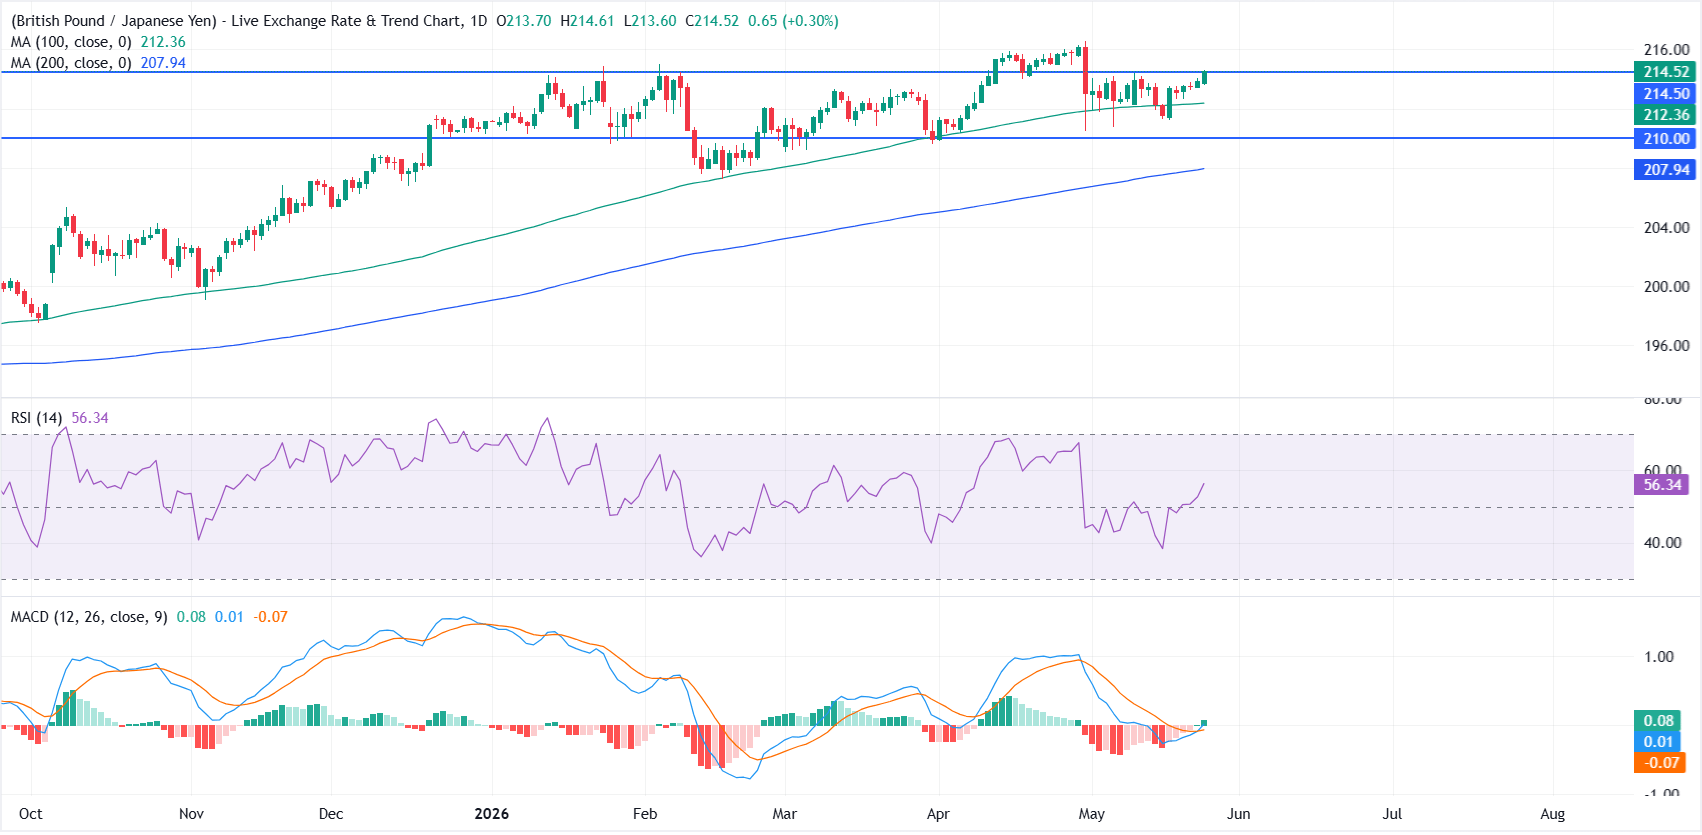
On the daily chart, GBP/JPY holds a constructive bullish bias as it grinds against the horizontal resistance at 214.50. The pair remains well above both the 100-day and 200-day Simple Moving Averages (SMAs) at 212.36 and 207.94, which suggests the broader uptrend stays intact, while a mildly positive Relative Strength Index (RSI) around 56 and a slightly positive Moving Average Convergence Divergence (MACD) reading hint at recovering upside momentum.
On the topside, immediate resistance is located at 214.50, and a sustained break above this barrier would open the way for further gains in the near term.
On the downside, initial support is seen at the 100-day SMA around 212.36, followed by the horizontal floor near 210.00, with the 200-day SMA at 207.94 reinforcing the broader bullish structure on deeper pullbacks.
(The technical analysis of this story was written with the help of an AI tool.)
Pound Sterling Price Today
The table below shows the percentage change of British Pound (GBP) against listed major currencies today. British Pound was the strongest against the US Dollar.
| USD | EUR | GBP | JPY | CAD | AUD | NZD | CHF | |
|---|---|---|---|---|---|---|---|---|
| USD | -0.33% | -0.48% | -0.17% | -0.13% | -0.67% | -0.41% | -0.18% | |
| EUR | 0.33% | -0.16% | 0.15% | 0.18% | -0.36% | -0.08% | 0.13% | |
| GBP | 0.48% | 0.16% | 0.30% | 0.34% | -0.20% | 0.08% | 0.28% | |
| JPY | 0.17% | -0.15% | -0.30% | 0.04% | -0.53% | -0.27% | -0.06% | |
| CAD | 0.13% | -0.18% | -0.34% | -0.04% | -0.55% | -0.29% | -0.09% | |
| AUD | 0.67% | 0.36% | 0.20% | 0.53% | 0.55% | 0.27% | 0.48% | |
| NZD | 0.41% | 0.08% | -0.08% | 0.27% | 0.29% | -0.27% | 0.19% | |
| CHF | 0.18% | -0.13% | -0.28% | 0.06% | 0.09% | -0.48% | -0.19% |
The heat map shows percentage changes of major currencies against each other. The base currency is picked from the left column, while the quote currency is picked from the top row. For example, if you pick the British Pound from the left column and move along the horizontal line to the US Dollar, the percentage change displayed in the box will represent GBP (base)/USD (quote).
Author

Vishal Chaturvedi
FXStreet
I am a macro-focused research analyst with over four years of experience covering forex and commodities market. I enjoy breaking down complex economic trends and turning them into clear, actionable insights that help traders stay ahead of the curve.