|

GBP/JPY Price Analysis: Loses traction below 183.00 within the descending trend-channel following the UK data

  • GBP/JPY remains under selling pressure near 182.65 after the UK's weaker-than-expected data.
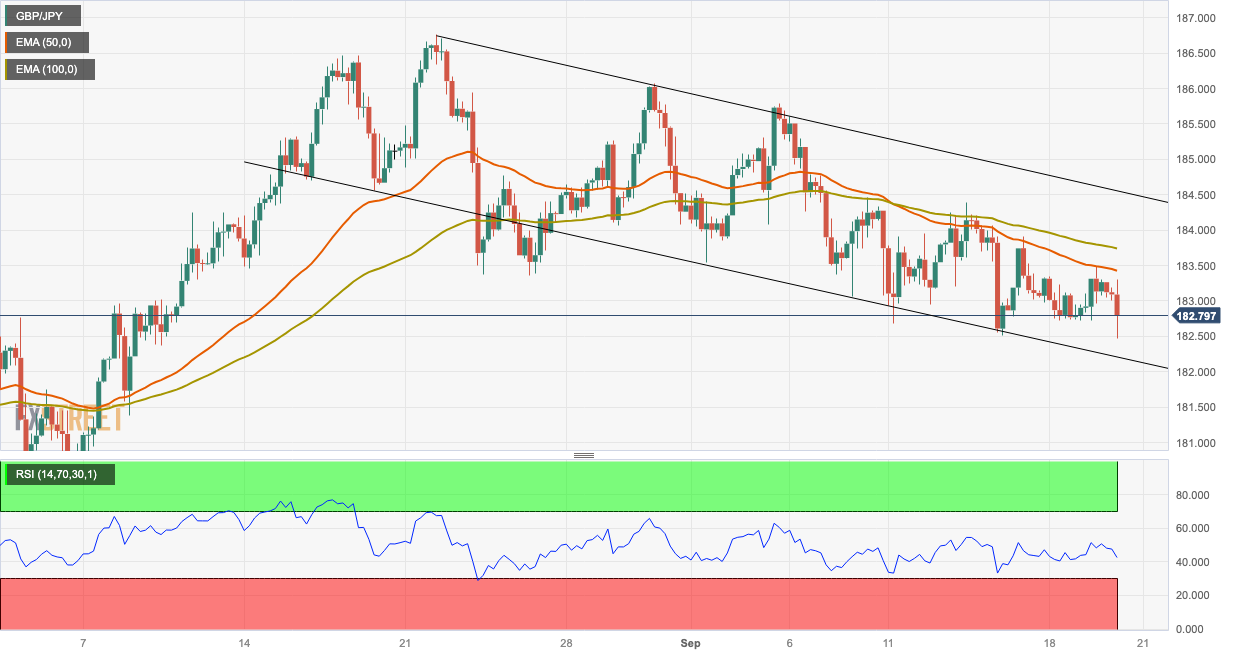
  • The cross holds below the 50- and 100-hour EMAs with a downward slope on the four-hour chart.
  • The immediate resistance level is seen at 183.00; 182.20 acts as an initial support level.

The GBP/JPY cross loses momentum during the early European session on Wednesday. The British Pound (GBP) faces some selling pressure following the softer-than-expected economic data from the UK. The market mood remains cautious as investors await the Bank of England (BoE) interest rate decision on Thursday. The cross currently trades near 182.65, losing 0.31% on the day. 

The latest data from the UK's Office for National Statistics reported on Wednesday revealed that the nation’s Consumer Price Index (CPI) dropped to 6.7% YoY in August from 6.8% in the previous reading, below the market consensus of 7.1%. In the same period, the Core CPI, which excludes volatile food and energy prices, fell to 6.2% from 6.9% in the previous month. Additionally, the Retail Price Index climbed 9.1% YoY in August, compared to expectations of 9.3%. In response to the data, GBP/JPY dropped more than 50 pips to below the 183.00 mark.

From the technical perspective, the GBP/JPY cross trades within the descending trend-channel since the middle of August. The cross holds below the 50- and 100-hour Exponential Moving Averages (EMAs) with a downward slope on the four-hour chart, highlighting the path of least resistance for the cross is to the downside.

The first resistance level of GBP/JPY is seen at a psycholocal mark of 183.00, followed by 183.42 (the 50-hour EMA). The additional upside filter to watch is 183.75 (the 100-hour EMA). Further north, the next stop is located near the upper boundary of the descending trend-channel at 184.55. Any meaningful follow-through buying will see the next stop at 185.25 (a high of August 29)/

On the downside, a decisive break below the lower limit of the descending trend-channel at 182.20 will see a drop to a psychological round figure at 182.00 en route to 181.38 (a low of August 8) and finally at 180.90 (a low of July 30).

Furthermore, the Relative Strength Index (RSI) is located in bearish territory below 50, highlighting that further downside cannot be ruled out.

GBP/JPY four-hour chart

GBP/JPY

Overview
Today last price182.88
Today Daily Change-0.35
Today Daily Change %-0.19
Today daily open183.23
 
Trends
Daily SMA20184.12
Daily SMA50183.2
Daily SMA100179.69
Daily SMA200171.01
 
Levels
Previous Daily High183.49
Previous Daily Low182.72
Previous Weekly High184.39
Previous Weekly Low182.52
Previous Monthly High186.77
Previous Monthly Low180.46
Daily Fibonacci 38.2%183.2
Daily Fibonacci 61.8%183.02
Daily Pivot Point S1182.8
Daily Pivot Point S2182.38
Daily Pivot Point S3182.04
Daily Pivot Point R1183.58
Daily Pivot Point R2183.92
Daily Pivot Point R3184.34

Author

Lallalit Srijandorn

Lallalit Srijandorn is a Parisian at heart. She has lived in France since 2019 and now becomes a digital entrepreneur based in Paris and Bangkok.

More from Lallalit Srijandorn
Share:

Markets move fast. We move first.

Orange Juice Newsletter brings you expert driven insights - not headlines. Every day on your inbox.

By subscribing you agree to our Terms and conditions.

Editor's Picks

EUR/USD rebounds after falling toward 1.1700

EUR/USD gains traction and trades above 1.1730 in the American session, looking to end the week virtually unchanged. The bullish opening in Wall Street makes it difficult for the US Dollar to preserve its recovery momentum and helps the pair rebound heading into the weekend.

GBP/USD steadies below 1.3400 as traders assess BoE policy outlook

Following Thursday's volatile session, GBP/USD moves sideways below 1.3400 on Friday. Investors reassess the Bank of England's policy oıtlook after the MPC decided to cut the interest rate by 25 bps by a slim margin. Meanwhile, the improving risk mood helps the pair hold its ground.

Gold stays below $4,350, looks to post small weekly gains

Gold struggles to gather recovery momentum and stays below $4,350 in the second half of the day on Friday, as the benchmark 10-year US Treasury bond yield edges higher. Nevertheless, the precious metal remains on track to end the week with modest gains as markets gear up for the holiday season.

Crypto Today: Bitcoin, Ethereum, XRP rebound amid bearish market conditions

Bitcoin (BTC) is edging higher, trading above $88,000 at the time of writing on Monday. Altcoins, including Ethereum (ETH) and Ripple (XRP), are following in BTC’s footsteps, experiencing relief rebounds following a volatile week.

How much can one month of soft inflation change the Fed’s mind?

One month of softer inflation data is rarely enough to shift Federal Reserve policy on its own, but in a market highly sensitive to every data point, even a single reading can reshape expectations. November’s inflation report offered a welcome sign of cooling price pressures. 

XRP rebounds amid ETF inflows and declining retail demand demand

XRP rebounds as bulls target a short-term breakout above $2.00 on Friday. XRP ETFs record the highest inflow since December 8, signaling growing institutional appetite.