- GBP/JPY could navigate the support region around the five-month low at 187.05.
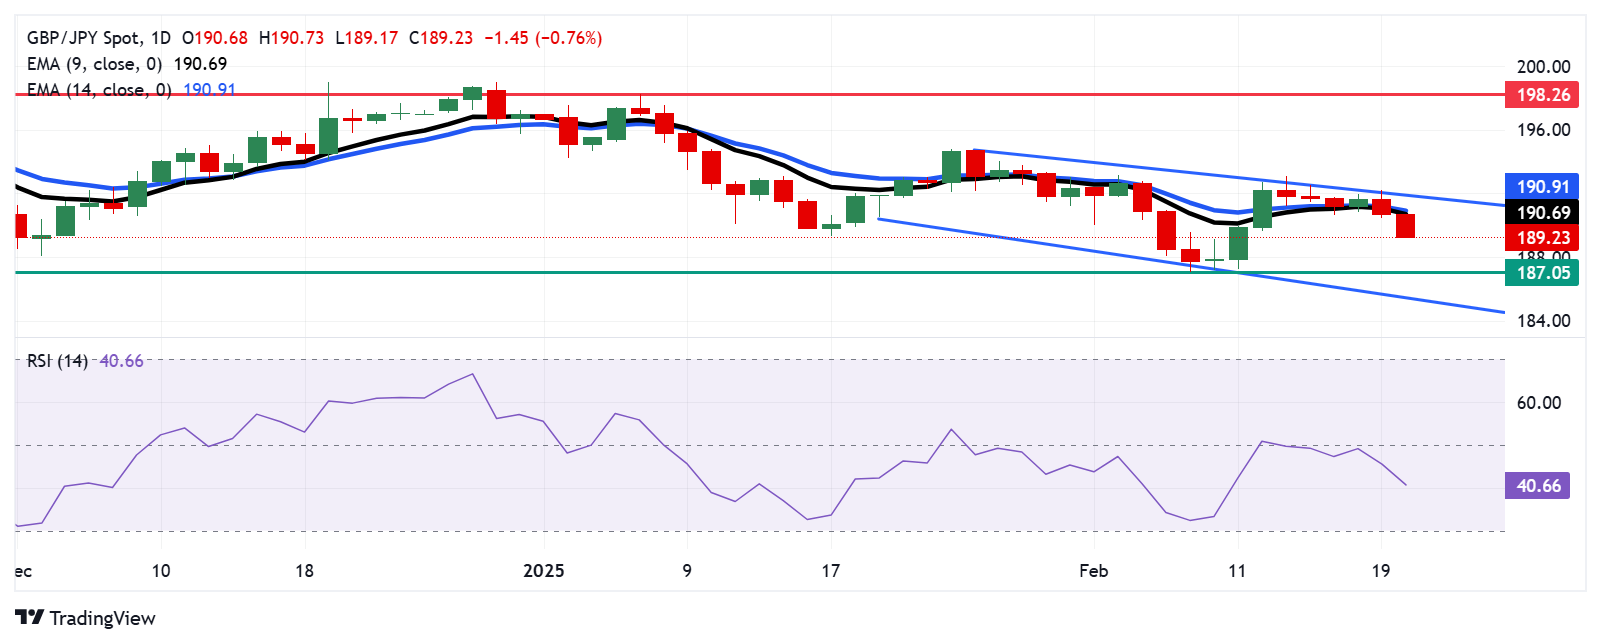
- The 14-day RSI remains below the 50 level, indicating strengthening bearish momentum.
- The immediate resistance appears at the nine-day EMA of 190.69.
GBP/JPY extends its decline for the second consecutive day, trading around 189.30 during Asian hours on Thursday. A daily chart analysis suggests that the currency cross remains within a descending channel pattern, signaling a continued bearish bias.
The 14-day Relative Strength Index (RSI), a key momentum indicator, remains below the 50 level, reinforcing the bearish momentum. Moreover, the GBP/JPY cross continues to trade below the nine- and 14-day Exponential Moving Averages (EMAs), indicating weaker short-term price momentum.
Regarding its support, the GBP/JPY cross could navigate the region around a five-month low at 187.05, which was recorded on February 7, followed by the lower boundary of the descending channel around the 185.50 level.
On the upside, the GBP/JPY cross could test immediate resistance at the nine-day EMA of 190.69, followed by the 14-day EMA at 190.91. A break above these levels could weaken the bearish bias and support the currency cross to test the descending channel’s upper boundary at the 192.00 level.
A break above the channel would weaken the bearish bias and support the GBP/JPY cross to explore the area around the two-month high of 198.26.
GBP/JPY: Daily Chart
British Pound PRICE Today
The table below shows the percentage change of British Pound (GBP) against listed major currencies today. British Pound was the weakest against the Japanese Yen.
USD | EUR | GBP | JPY | CAD | AUD | NZD | CHF | |
---|---|---|---|---|---|---|---|---|
USD | -0.07% | -0.08% | -0.81% | -0.03% | -0.28% | -0.29% | -0.17% | |
EUR | 0.07% | -0.01% | -0.77% | 0.04% | -0.21% | -0.22% | -0.12% | |
GBP | 0.08% | 0.01% | -0.74% | 0.06% | -0.20% | -0.21% | -0.09% | |
JPY | 0.81% | 0.77% | 0.74% | 0.78% | 0.54% | 0.49% | 0.64% | |
CAD | 0.03% | -0.04% | -0.06% | -0.78% | -0.25% | -0.26% | -0.14% | |
AUD | 0.28% | 0.21% | 0.20% | -0.54% | 0.25% | -0.01% | 0.09% | |
NZD | 0.29% | 0.22% | 0.21% | -0.49% | 0.26% | 0.01% | 0.12% | |
CHF | 0.17% | 0.12% | 0.09% | -0.64% | 0.14% | -0.09% | -0.12% |
The heat map shows percentage changes of major currencies against each other. The base currency is picked from the left column, while the quote currency is picked from the top row. For example, if you pick the British Pound from the left column and move along the horizontal line to the US Dollar, the percentage change displayed in the box will represent GBP (base)/USD (quote).
Information on these pages contains forward-looking statements that involve risks and uncertainties. Markets and instruments profiled on this page are for informational purposes only and should not in any way come across as a recommendation to buy or sell in these assets. You should do your own thorough research before making any investment decisions. FXStreet does not in any way guarantee that this information is free from mistakes, errors, or material misstatements. It also does not guarantee that this information is of a timely nature. Investing in Open Markets involves a great deal of risk, including the loss of all or a portion of your investment, as well as emotional distress. All risks, losses and costs associated with investing, including total loss of principal, are your responsibility. The views and opinions expressed in this article are those of the authors and do not necessarily reflect the official policy or position of FXStreet nor its advertisers. The author will not be held responsible for information that is found at the end of links posted on this page.
If not otherwise explicitly mentioned in the body of the article, at the time of writing, the author has no position in any stock mentioned in this article and no business relationship with any company mentioned. The author has not received compensation for writing this article, other than from FXStreet.
FXStreet and the author do not provide personalized recommendations. The author makes no representations as to the accuracy, completeness, or suitability of this information. FXStreet and the author will not be liable for any errors, omissions or any losses, injuries or damages arising from this information and its display or use. Errors and omissions excepted.
The author and FXStreet are not registered investment advisors and nothing in this article is intended to be investment advice.
Recommended content
Editors’ Picks

EUR/USD bounces off lows, retests 1.1370
Following an early drop to the vicinity of 1.1310, EUR/USD now manages to regain pace and retargets the 1.1370-1.1380 band on the back of a tepid knee-jerk in the US Dollar, always amid growing optimism over a potential de-escalation in the US-China trade war.

GBP/USD trades slightly on the defensive in the low-1.3300s
GBP/USD remains under a mild selling pressure just above 1.3300 on Friday, despite firmer-than-expected UK Retail Sales. The pair is weighed down by a renewed buying interest in the Greenback, bolstered by fresh headlines suggesting a softening in the rhetoric surrounding the US-China trade conflict.

Gold remains offered below $3,300
Gold reversed Thursday’s rebound and slipped toward the $3,260 area per troy ounce at the end of the week in response to further improvement in the market sentiment, which was in turn underpinned by hopes of positive developments around the US-China trade crisis.

Ethereum: Accumulation addresses grab 1.11 million ETH as bullish momentum rises
Ethereum saw a 1% decline on Friday as sellers dominated exchange activity in the past 24 hours. Despite the recent selling, increased inflows into accumulation addresses and declining net taker volume show a gradual return of bullish momentum.

Week ahead: US GDP, inflation and jobs in focus amid tariff mess – BoJ meets
Barrage of US data to shed light on US economy as tariff war heats up. GDP, PCE inflation and nonfarm payrolls reports to headline the week. Bank of Japan to hold rates but may downgrade growth outlook. Eurozone and Australian CPI also on the agenda, Canadians go to the polls.

The Best brokers to trade EUR/USD
SPONSORED Discover the top brokers for trading EUR/USD in 2025. Our list features brokers with competitive spreads, fast execution, and powerful platforms. Whether you're a beginner or an expert, find the right partner to navigate the dynamic Forex market.