|

GBP/JPY Price Analysis: Faces pullback as rising wedge emerges despite bullish indicators

  • Despite technical indicators predicting further upside, GBP/JPY sees consecutive negative sessions; it currently trades at 173.44.
  • Potential pullback looms, with immediate support at the Tenkan-Sen line of 173.43 and further at 173.00.
  • For bullish continuation, GBP/JPY needs to claim the 174.00 mark.

GBP/JPY registers back-to-back negative sessions, sponsored by risk aversion; though technical indicators suggest further upside, price action means the rally is losing steam. As the Asian session begins, the GBP/JPY trades at 173.44, up a minuscule 0.01%.

GBP/JPY Price Analysis: Technical outlook

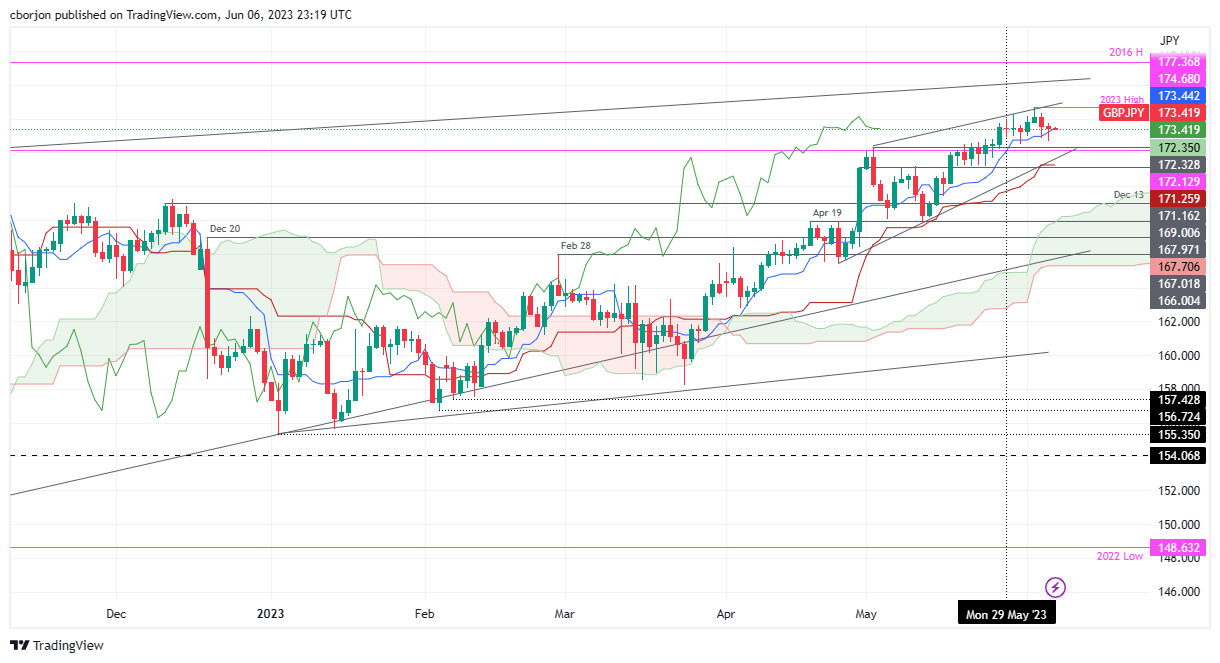
The GBP/JPY is upward biased thought; it could be subject to a pullback, as the GBP/JPY is forming a rising wedge. On the downside, prices remain capped by the Tenkan-Sen line at 173.43, which would act as immediate support, but with a decisive break below the latter, the GBP/JPY could dive towards the 173.00 figure. The following support would be the May 2 high at 172.33, followed by the Kijun-Sen line at 171.26.

The GBP/JPY must claim the 174.00 mark for a bullish continuation. A breach of the latter will expose the YTD high at 174.68, with buyers eyeing 2016 high at 177.37.

GBP/JPY Price Action – Daily chart

GBP/JPY Daily chart

GBP/JPY

Overview
Today last price173.43
Today Daily Change-0.21
Today Daily Change %-0.12
Today daily open173.64
 
Trends
Daily SMA20171.96
Daily SMA50168.75
Daily SMA100164.95
Daily SMA200164.54
 
Levels
Previous Daily High174.38
Previous Daily Low172.85
Previous Weekly High174.68
Previous Weekly Low172.53
Previous Monthly High174.28
Previous Monthly Low167.84
Daily Fibonacci 38.2%173.44
Daily Fibonacci 61.8%173.8
Daily Pivot Point S1172.87
Daily Pivot Point S2172.1
Daily Pivot Point S3171.35
Daily Pivot Point R1174.4
Daily Pivot Point R2175.15
Daily Pivot Point R3175.93

Author

Christian Borjon Valencia

Markets analyst, news editor, and trading instructor with over 14 years of experience across FX, commodities, US equity indices, and global macro markets.

More from Christian Borjon Valencia
Share:

Editor's Picks

EUR/USD recedes to daily lows near 1.1850

EUR/USD keeps its bearish momentum well in place, slipping back to the area of 1.1850 to hit daily lows on Monday. The pair’s continuation of the leg lower comes amid decent gains in the US Dollar in a context of scarce volatility and thin trade conditions due to the inactivity in the US markets.

GBP/USD resumes the downtrend, back to the low-1.3600s

GBP/USD rapidly leaves behind Friday’s decent advance, refocusing on the downside and retreating to the 1.3630 region at the beginning of the week. In the meantime, the British Pound is expected to remain under the microscope ahead of the release of the key UK labour market report on Tuesday.

Gold looks inconclusive around $5,000

Gold partially fades Friday’s strong recovery, orbiting around the key $5,000 region per troy ounce in a context of humble gains in the Greenback on Monday. Additing to the vacillating mood, trade conditions remain thin amid the observance of the Presidents Day holiday in the US.

Bitcoin consolidates as on-chain data show mixed signals

Bitcoin price has consolidated between $65,700 and $72,000 over the past nine days, with no clear directional bias. US-listed spot ETFs recorded a $359.91 million weekly outflow, marking the fourth consecutive week of withdrawals.

The week ahead: Key inflation readings and why the AI trade could be overdone

It is likely to be a quiet start to the week, with US markets closed on Monday for Presidents Day. European markets are higher across the board and gold is clinging to the $5,000 level after the tamer than expected CPI report in the US reduced haven flows to precious metals.

Monero Price Forecast: XMR risks a drop below $300 under mounting bearish pressure

Monero (XMR) starts the week under pressure, recording a 4% decline at press time on Monday after a 7% drop the previous day, putting the $300 support zone in focus.