GBP/JPY Price Analysis: Bullish candlesticks formations paved the way to 161.00 and beyond


  • The GBP/JPY advanced on Friday, recording gains of 0.57%.
  • A positive market mood boosts risk-sensitive currencies like the GBP, weighing on safe-haven peers, like the yen.
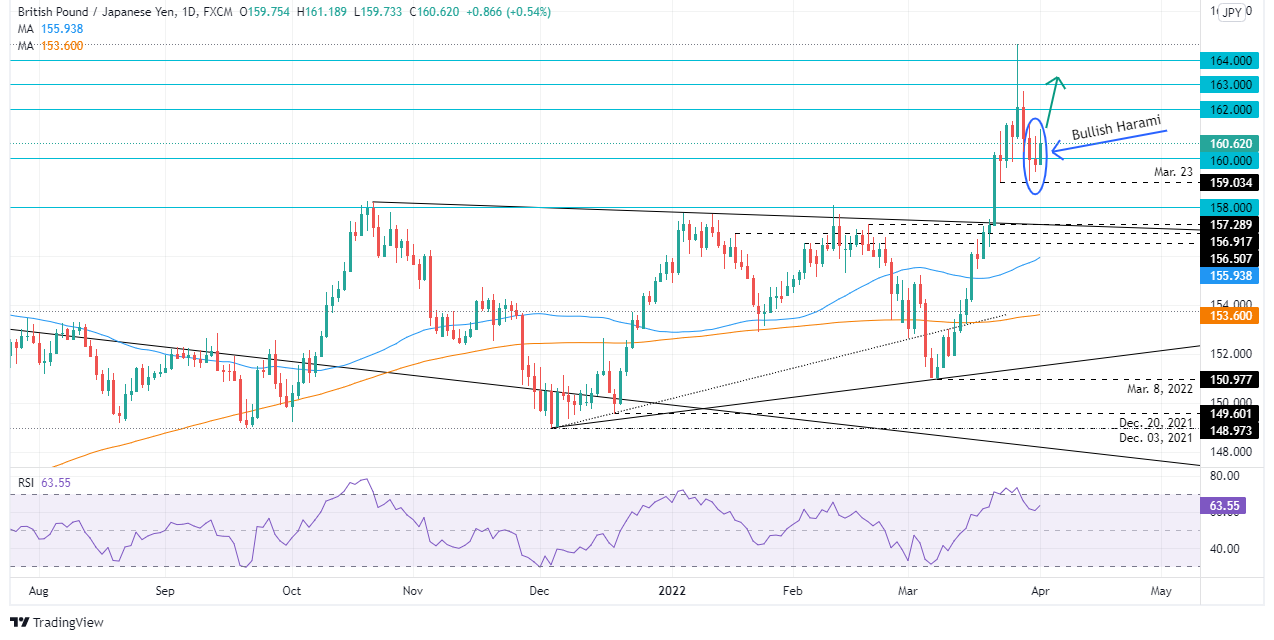
  • GBP/JPY Price Forecast: The “inverted hammer” and a “bullish harami” confluence keep the uptrend intact.

The GBP/JPY snaps three days of losses and jumps off Thursday’s losses amid a shift from a dismal to a favorable market mood, despite the continuation of Rissian’s invasion of Ukraine and market players’ worries about global inflation. At press time, the GBP/JPY is trading at 160.71.

Reflection of the positive market mood is European and US equities recording gains. Meanwhile, US Treasury yields surge, led by the short-end of the yield curve, with 2s and 5s rising more than the 10s and 30s, inverting the yield curve for the second time in three days.

Meanwhile, the Russia-Ukraine war continues for the fifth straight week. On Thursday, Russian President Putin stated that natural gas payments in roubles are irreversible and gave ten days of grace to European customers.

GBP/JPY Price Forecast: Technical outlook

The GBP/JPY jumped off the 160.00 mark and is testing Thursday’s daily high at 160.88, but short of it. On Thursday, I noted that “a “quasi” gravestone doji” was forming; instead, an inverted hammer showed up, and it is worth noting that Thursday’s price action formed a bullish harami.

That said, the GBP/JPY uptrend is still intact, and the previous days’ price action formed a bottom around the 159.00-160.00 area. Upwards, the GBP/JPY first resistance would be 161.00. Breach of the latter would expose March 30 high at 161.36, followed by 162.00

Technical levels to watch for

GBP/JPY

Overview
Today last price 160.71
Today Daily Change 0.87
Today Daily Change % 0.54
Today daily open 159.84
 
Trends
Daily SMA20 156.59
Daily SMA50 155.85
Daily SMA100 154.62
Daily SMA200 153.63
 
Levels
Previous Daily High 160.89
Previous Daily Low 159.44
Previous Weekly High 161.5
Previous Weekly Low 156.38
Previous Monthly High 164.64
Previous Monthly Low 150.99
Daily Fibonacci 38.2% 159.99
Daily Fibonacci 61.8% 160.34
Daily Pivot Point S1 159.22
Daily Pivot Point S2 158.61
Daily Pivot Point S3 157.77
Daily Pivot Point R1 160.67
Daily Pivot Point R2 161.51
Daily Pivot Point R3 162.12


Share: Feed news

Information on these pages contains forward-looking statements that involve risks and uncertainties. Markets and instruments profiled on this page are for informational purposes only and should not in any way come across as a recommendation to buy or sell in these assets. You should do your own thorough research before making any investment decisions. FXStreet does not in any way guarantee that this information is free from mistakes, errors, or material misstatements. It also does not guarantee that this information is of a timely nature. Investing in Open Markets involves a great deal of risk, including the loss of all or a portion of your investment, as well as emotional distress. All risks, losses and costs associated with investing, including total loss of principal, are your responsibility. The views and opinions expressed in this article are those of the authors and do not necessarily reflect the official policy or position of FXStreet nor its advertisers. The author will not be held responsible for information that is found at the end of links posted on this page.

If not otherwise explicitly mentioned in the body of the article, at the time of writing, the author has no position in any stock mentioned in this article and no business relationship with any company mentioned. The author has not received compensation for writing this article, other than from FXStreet.

FXStreet and the author do not provide personalized recommendations. The author makes no representations as to the accuracy, completeness, or suitability of this information. FXStreet and the author will not be liable for any errors, omissions or any losses, injuries or damages arising from this information and its display or use. Errors and omissions excepted.

The author and FXStreet are not registered investment advisors and nothing in this article is intended to be investment advice.

Recommended content


Recommended content

Editors’ Picks

EUR/USD clings to daily gains above 1.0650

EUR/USD clings to daily gains above 1.0650

EUR/USD gained traction and turned positive on the day above 1.0650. The improvement seen in risk mood following the earlier flight to safety weighs on the US Dollar ahead of the weekend and helps the pair push higher.

EUR/USD News

GBP/USD recovers toward 1.2450 after UK Retail Sales data

GBP/USD recovers toward 1.2450 after UK Retail Sales data

GBP/USD reversed its direction and advanced to the 1.2450 area after touching a fresh multi-month low below 1.2400 in the Asian session. The positive shift seen in risk mood on easing fears over a deepening Iran-Israel conflict supports the pair.

GBP/USD News

Gold holds steady at around $2,380 following earlier spike

Gold holds steady at around $2,380 following earlier spike

Gold stabilized near $2,380 after spiking above $2,400 with the immediate reaction to reports of Israel striking Iran. Meanwhile, the pullback seen in the US Treasury bond yields helps XAU/USD hold its ground.

Gold News

Bitcoin Weekly Forecast: BTC post-halving rally could be partially priced in Premium

Bitcoin Weekly Forecast: BTC post-halving rally could be partially priced in

Bitcoin price shows no signs of directional bias while it holds above  $60,000. The fourth BTC halving is partially priced in, according to Deutsche Bank’s research. 

Read more

Week ahead – US GDP and BoJ decision on top of next week’s agenda

Week ahead – US GDP and BoJ decision on top of next week’s agenda

US GDP, core PCE and PMIs the next tests for the Dollar. Investors await BoJ for guidance about next rate hike. EU and UK PMIs, as well as Australian CPIs also on tap.

Read more

Forex MAJORS

Cryptocurrencies

Signatures