|

GBP/CAD Price Prediction: Price flirts with lower boundary line of Rising Wedge pattern

  • GBP/CAD falls to the lower boundary of a bearish price pattern. 
  • A clean break lower could indicate the start of a new downtrending cycle. 

GBP/CAD falls to the lower boundary line of a Rising Wedge pattern and the level of the (red) 50-day Simple Moving Average (SMA) at about 1.7826. Rising Wedges are usually bearish patterns, however, there is no way of confirming this is such a pattern, although it looks very much like one.

GBP/CAD Daily Chart 

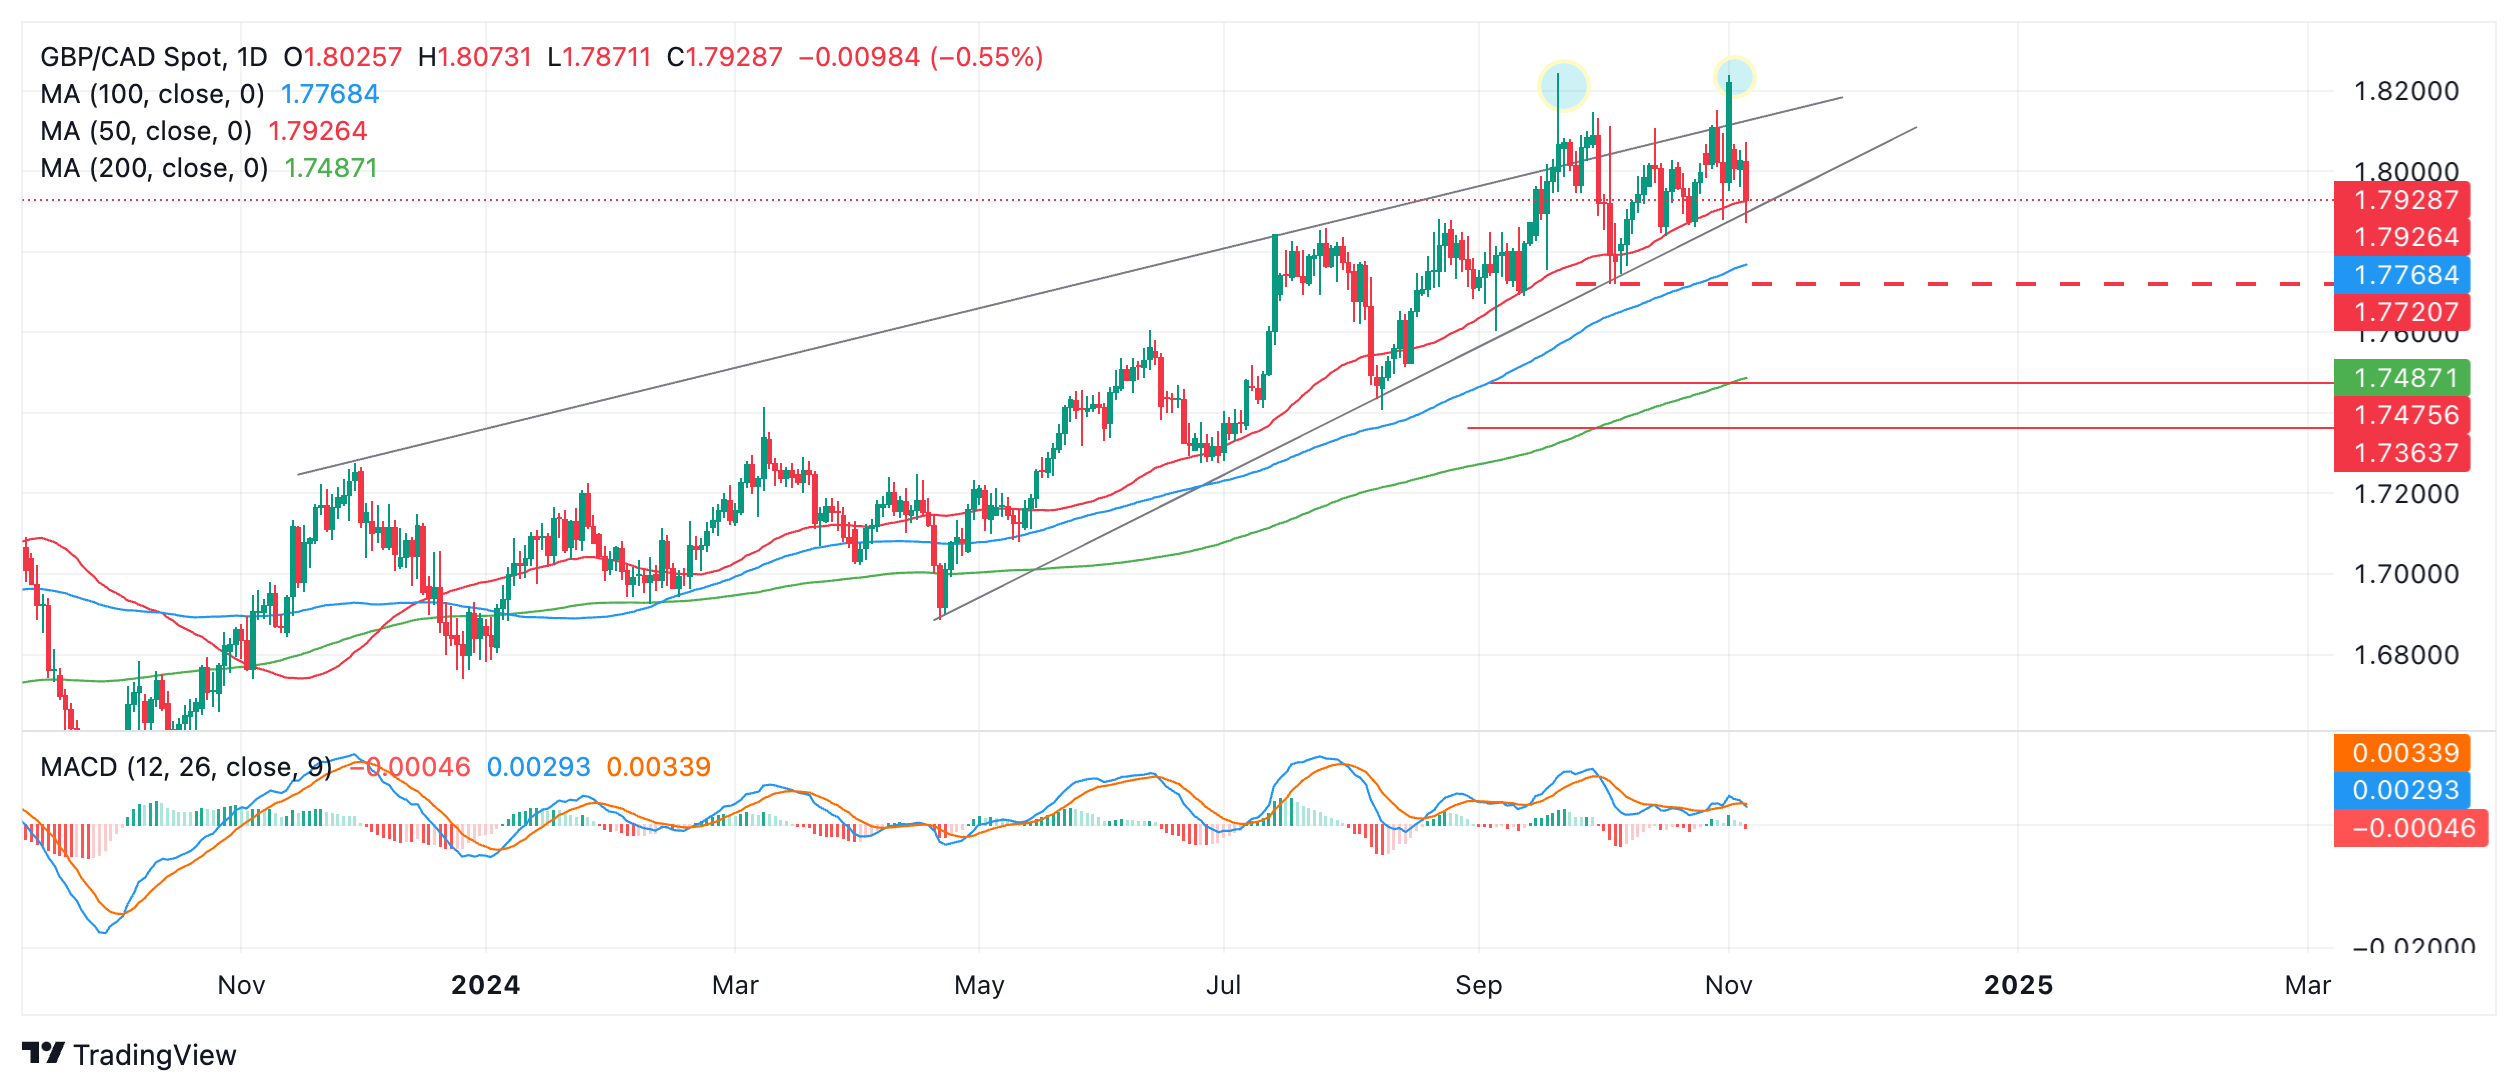
A decisive break below the lower boundary line could see a decline to about the level of the 200-day SMA at around 1.7487. Further bearishness could lead to a move down to a target at 1.7364.

A break below the red dashed line on the chart at the key 1.7719 October 3 swing low would provide more cast-iron confirmation of a breakout and reversal in the medium-term uptrend. 

GBP/CAD broke temporarily above the upper guardrail of the Rising Wedge pattern on several occasions (blue circles on chart) on September 20 and November 1. This could be a sign of bullish exhaustion and an early warning of impending reversal. 

The Moving Average Convergence Divergence (MACD) momentum indicator has been flat recently but looks poised to break lower – a mildly bearish sign on the chart.

Author

Joaquin Monfort

Joaquin Monfort is a financial writer and analyst with over 10 years experience writing about financial markets and alt data. He holds a degree in Anthropology from London University and a Diploma in Technical analysis.

More from Joaquin Monfort
Share:

Editor's Picks

AUD/USD eyes 0.7150 barrier nine-day EMA

AUD/USD inches higher after registering modest losses in the previous day, trading around 0.7130 during the Asian hours. The technical analysis of the daily chart indicates that the pair is moving sideways within the rectangle pattern, suggesting a consolidation as neither the bulls nor the bears have enough momentum to take control of the market.

USD/JPY trades below 160.00 intervention threshold; bullish bias intact

The USD/JPY pair attracts some sellers during the Asian session amid fears that authorities will step in again to prop up the Japanese Yen. Furthermore, the Israel-Lebanon truce prompts some profit-taking around the US Dollar and exerts downward pressure on the currency pair.

Gold defends 200-day SMA, rises toward $4,500

Gold is attempting a tepid recovery toward $4,500 on Thursday, as renewed optimism in the Mideast geopolitical front calms market nerves. This cautious optimism across Asian markets weighs on Oil prices, and diminishes the US Dollar’s safe-haven appeal, helping Gold stage a decent comeback from the weekly low of $4,424.


Hyperliquid: ETF demand, capital rotation fuel HYPE rally as Bitcoin melts

Hyperliquid price sustains an upward trend near its all-time high of $75.76 on Thursday after posting 80% gains in May, while Bitcoin (BTC) retraces below $65,000, triggering a market-wide panic.

Kevin Warsh takes the Fed helm: What it means for the US Dollar
The Federal Reserve moves away from the highly predictable "forward guidance" model of the Jerome Powell era to a new “Kevin Warsh environment”, characterized by less communication, more policy surprises, and an increased focus on the Fed's complex balance sheet.
Recession on paper: What really moves the Canadian Loonie now?

Statistics Canada handed the headline writers a gift and the analysts a headache. Real GDP shrank 0.1% on an annualized basis in the first quarter, and with the fourth quarter of 2025 revised down to a 1.0% contraction, that is two negative quarters in a row, the textbook definition of a technical recession and Canada's first since the pandemic.