Powell leaves Fed Sentiment Index anchored in dovish ground
In Tuesday’s speech at the Greater Providence Chamber of Commerce in Rhode Island, Chair Jerome Powell struck a more balanced tone, describing the Federal Reserve's (Fed) position as a “challenging situation”. In prepared remarks, he said policymakers face a delicate choice: cut rates too quickly and risk reigniting inflation, or move too slowly and risk unnecessary job losses.
With somewhat disappointing expectations, Powell offered little guidance on the timing of the next move, stressing instead the dangers on both sides of the policy debate.
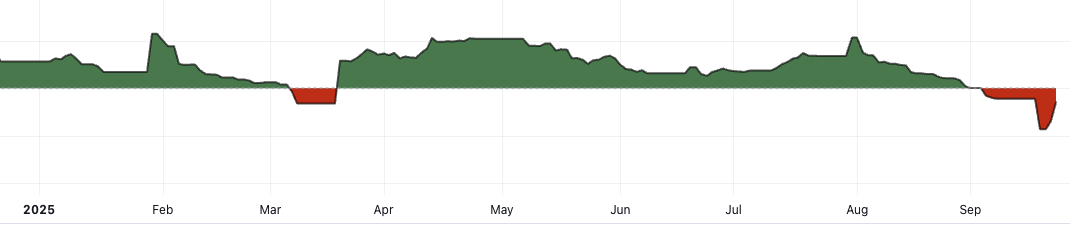
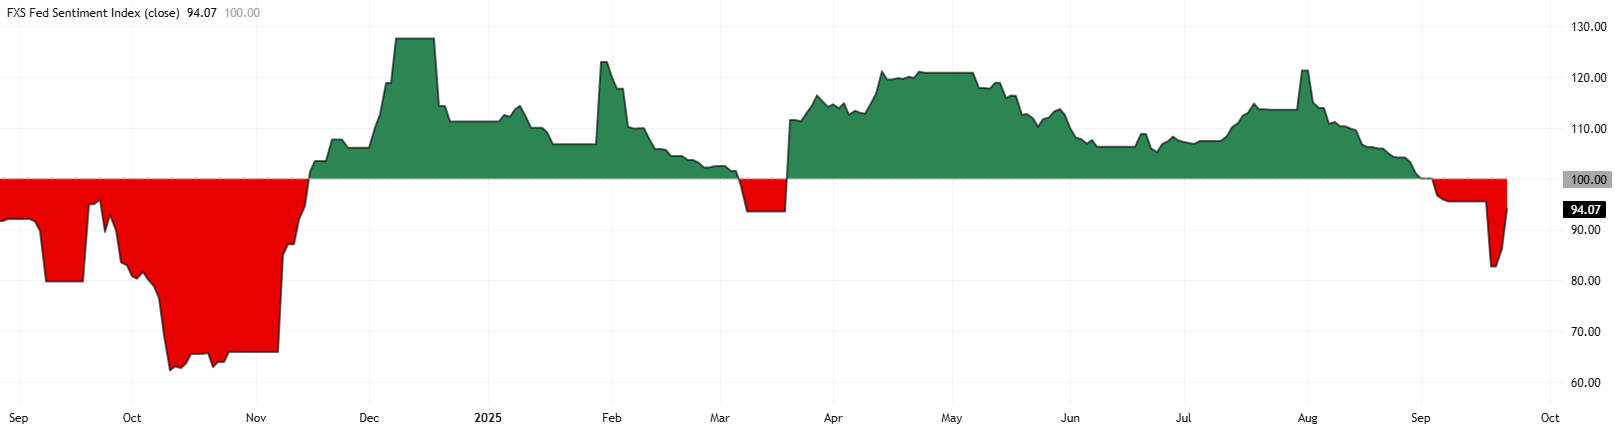
All in all, and after Powell’s speech, the FXStreet Fed Sentiment Index edged higher to 94.07, rebounding further from its earlier drop to levels last seen in November, capturing the sharp dovish turn in the Fed’s tone. While the index has bounced since then, it remains in the dovish region.
This section below was published as a preview of the FXStreet Fed Sentiment Index ahead of the speech by Chief Jerome Powell at 11:15 GMT.
- FXStreet Fed Sentiment Index stays below 100.00 after recovering from multi-month lows.
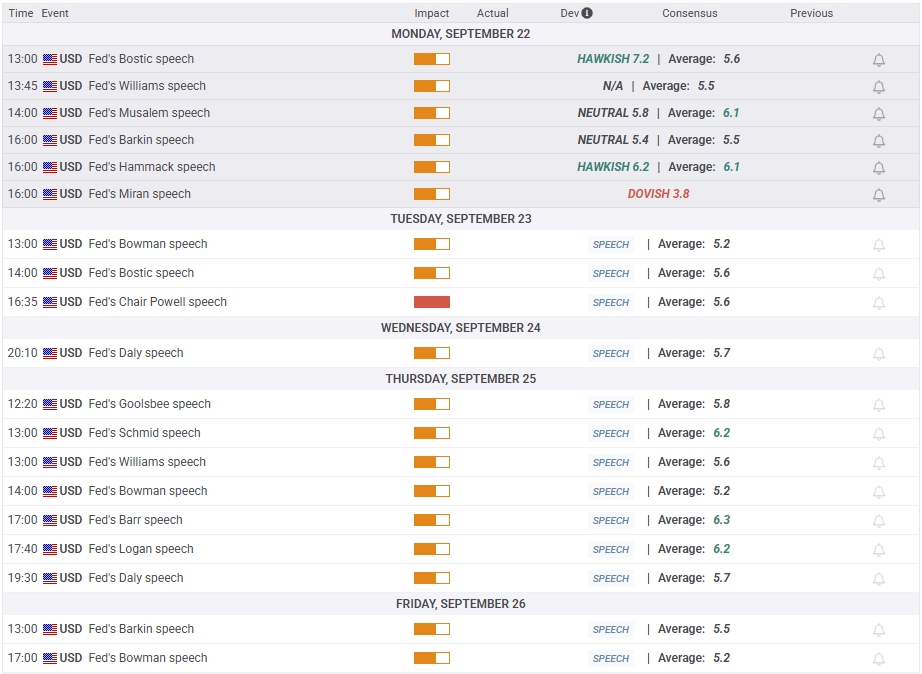
- Several Fed policymakers will be delivering speeches throughout the week.
- Markets widely expect the US central bank to cut rates twice more this year.
The Federal Reserve (Fed) decided to cut the policy rate by 25 basis-points (bps) to the range of 4%-4.25% following the September policy meeting, as widely anticipated. The revised Summary of Economic Projections (SEP), also known as the dot-plot, showed that projections imply additional 50 bps of rate cuts in 2025, 25 bps in 2026 and 25 bps in 2027.
While speaking at the post-meeting press conference, Fed Chair Jerome Powell noted that he doesn't feel the need to move quickly on rates and called the decision to lower the rates a "risk management cut." Although he noted that it's time to acknowledge that risks to the employment mandate have grown, he added that they still expect tariff-driven price increases to continue this year and next.
Following the Fed event, FXStreet Fed Sentiment Index dropped to its lowest level since early November at 82.74, reflecting a significant dovish tilt in the Fed's overall tone. Although FXStreet Fed Sentiment Index managed to recover since then, it remained within the dovish territory.
Newly appointed Fed policymaker Stephen Miran explained that he voted in favor of a 50 bps rate cut, arguing that the longer the policy stays restrictive, the greater the risks to the labor market. On a more neutral tone, San Francisco Fed President Mary Daly noted late Friday the Fed's move to cut rates was to try and bolster a weakening labor market, noting a pointed softening of the US economy over the past year.
On Monday, St. Louis Fed President Alberto Musalem said the monetary policy must continue to lean against inflation that remains above target. "An overemphasis on the labour market could lead to policy that is too loose and does more harm than good," Musalem argued. Similarly, Atlanta Fed President Raphael Bostic said he is concerned about inflation that has been too high for a long time.
Commenting on inflation dynamics, Richmond Fed President Thomas Barkin noted that tariff policies tend to result in higher prices for consumers and said that the primary point of concern for businesses remains cloudy trade policy, not high interest rates.
Finally, Cleveland President Beth Hammack warned that inflation pressures will likely persist for the time being, noting challenges on both sides of the Fed's mandate to both control inflation and support the labor market.
On Tuesday, Atlanta Fed President Bostic, Fed Governor Michelle Bowman and Fed Chair Powell will be delivering speeches.
Dot Plot FAQs
The “Dot Plot” is the popular name of the interest-rate projections by the Federal Open Market Committee (FOMC) of the US Federal Reserve (Fed), which implements monetary policy. These are published in the Summary of Economic Projections, a report in which FOMC members also release their individual projections on economic growth, the unemployment rate and inflation for the current year and the next few ones. The document consists of a chart plotting interest-rate projections, with each FOMC member’s forecast represented by a dot. The Fed also adds a table summarizing the range of forecasts and the median for each indicator. This makes it easier for market participants to see how policymakers expect the US economy to perform in the near, medium and long term.
The US Federal Reserve publishes the “Dot Plot” once every other meeting, or in four of the eight yearly scheduled meetings. The Summary of Economic Projections report is published along with the monetary policy decision.
The “Dot Plot” gives a comprehensive insight into the expectations from Federal Reserve (Fed) policymakers. As projections reflect each official’s projection for interest rates at the end of each year, it is considered a key forward-looking indicator. By looking at the “Dot Plot” and comparing the data to current interest-rate levels, market participants can see where policymakers expect rates to head to and the overall direction of monetary policy. As projections are released quarterly, the “Dot Plot” is widely used as a guide to figure out the terminal rate and the possible timing of a policy pivot.
The most market-moving data in the “Dot Plot” is the projection of the federal funds rate. Any change compared with previous projections is likely to influence the US Dollar (USD) valuation. Generally, if the “Dot Plot” shows that policymakers expect higher interest rates in the near term, this tends to be bullish for USD. Likewise, if projections point to lower rates ahead, the USD is likely to weaken.
Author

Eren Sengezer
FXStreet
As an economist at heart, Eren Sengezer specializes in the assessment of the short-term and long-term impacts of macroeconomic data, central bank policies and political developments on financial assets.


