|

EUR/USD Technical Analysis: Small bounce to 1.1280 on weak US Industrial Production
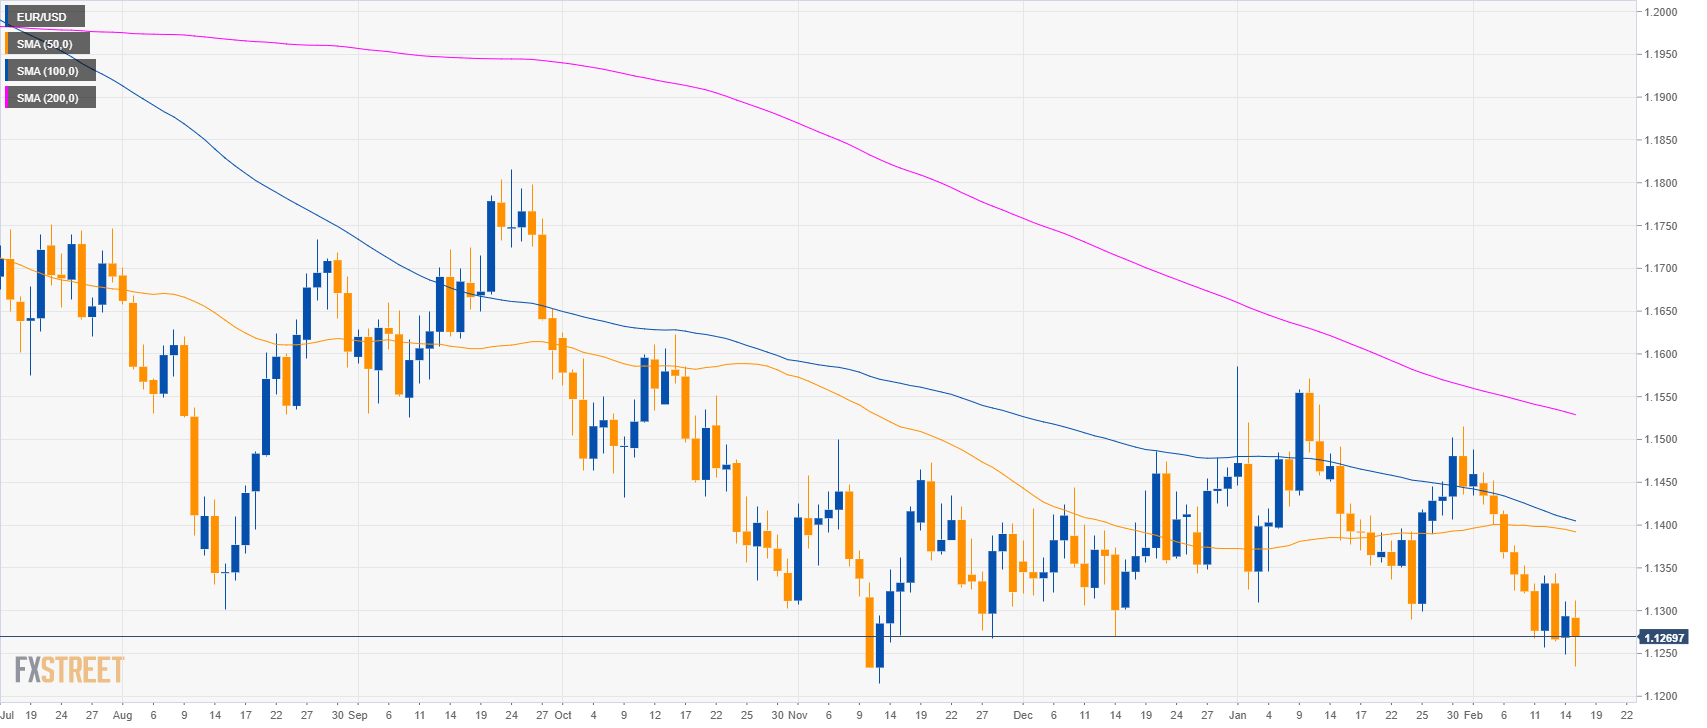
EUR/USD daily chart

  • EUR/USD is trading in a bear trend below the 200-day simple moving average (SMA).
  • The US Industrial Production in January (MoM) came below expectations at -0.6% vs. 0.1% forecast.

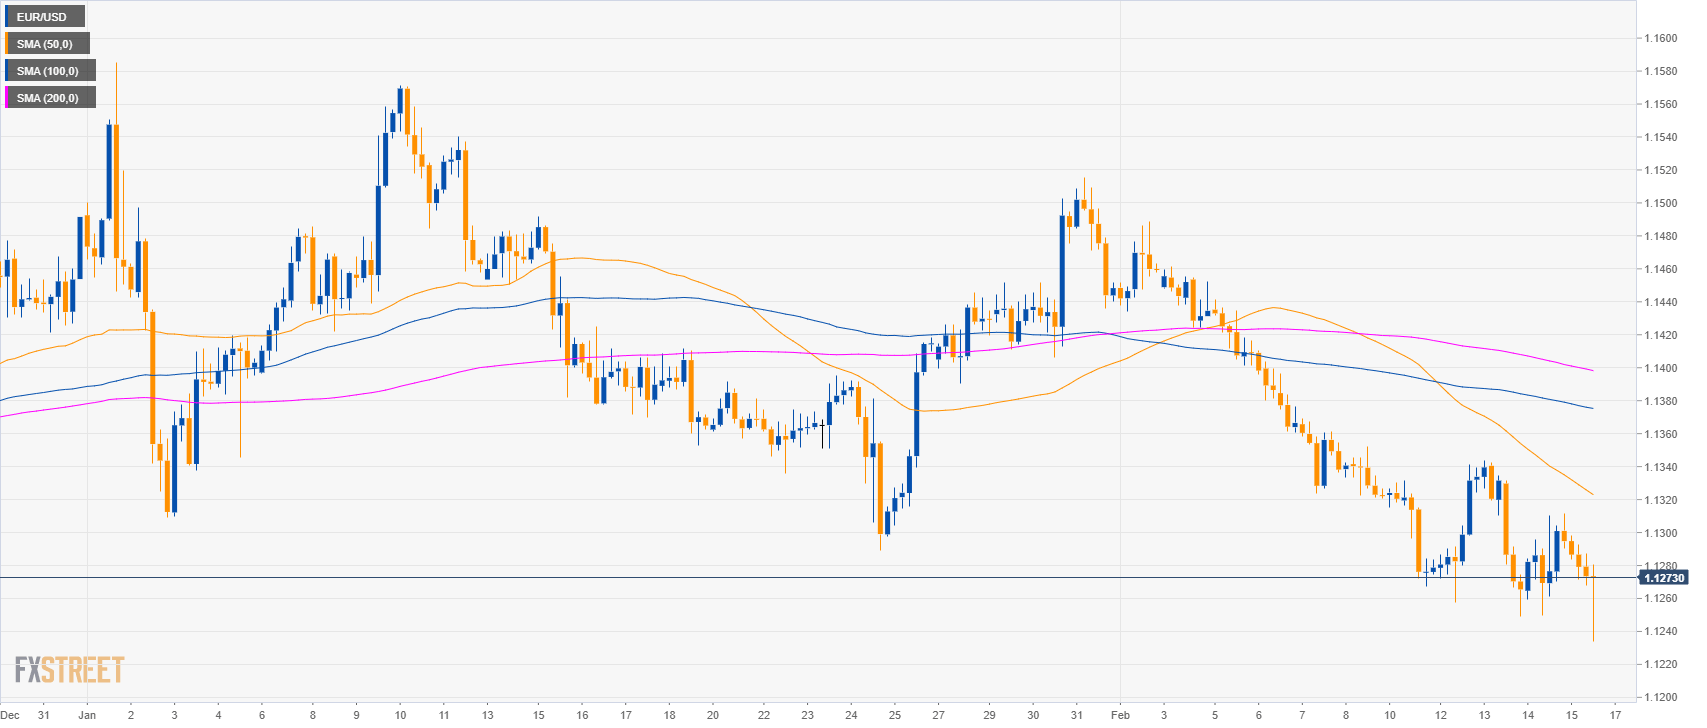
EUR/USD 4-hour chart

  • EUR/USD is trading below its main SMAs suggesting bearish momentum in the medium-term.

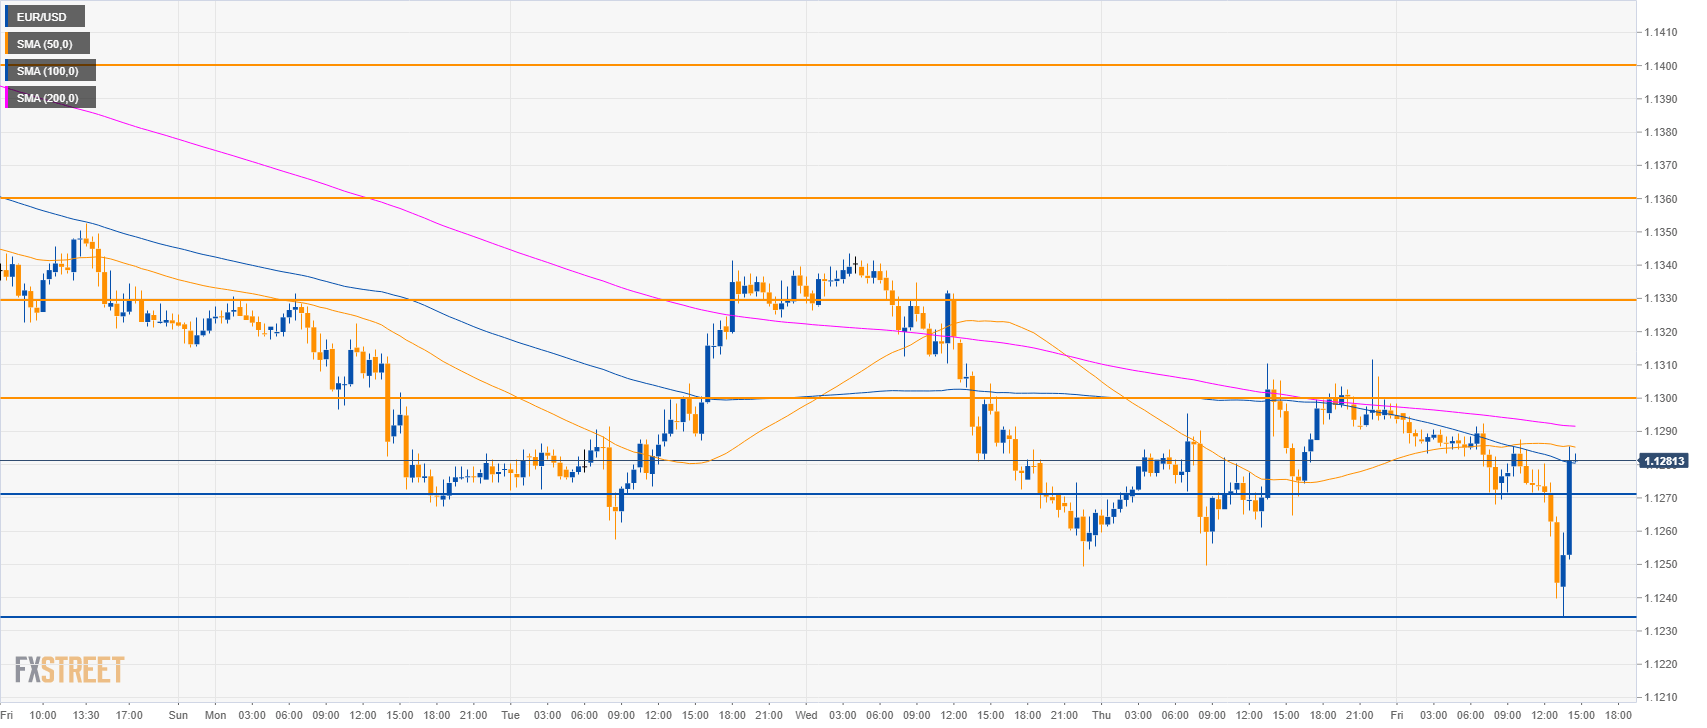
EUR/USD 30-minute chart

  • EUR/USD is trading below the main SMAs suggesting bearish momentum in the short-term.
  • Support is seen at 1.1230 level.
  • To the upside, bulls will most likely try to recapture 1.1300, 1.1330 and 1.1400 figure.

Additional key levels

EUR/USD

Overview:
    Today Last Price: 1.1263
    Today Daily change: -31 pips
    Today Daily change %: -0.27%
    Today Daily Open: 1.1294
Trends:
    Daily SMA20: 1.1374
    Daily SMA50: 1.1395
    Daily SMA100: 1.1408
    Daily SMA200: 1.1532
Levels:
    Previous Daily High: 1.1311
    Previous Daily Low: 1.1249
    Previous Weekly High: 1.1462
    Previous Weekly Low: 1.132
    Previous Monthly High: 1.1586
    Previous Monthly Low: 1.1289
    Daily Fibonacci 38.2%: 1.1287
    Daily Fibonacci 61.8%: 1.1273
    Daily Pivot Point S1: 1.1258
    Daily Pivot Point S2: 1.1223
    Daily Pivot Point S3: 1.1197
    Daily Pivot Point R1: 1.132
    Daily Pivot Point R2: 1.1346
    Daily Pivot Point R3: 1.1381

Author

Flavio Tosti

Flavio Tosti

Independent Analyst


More from Flavio Tosti
Share:

Editor's Picks

EUR/USD stays well offered below 1.1800

The selling pressure on EUR/USD is picking up pace, with the pair slipping decisively below the key 1.1800 level and sliding to fresh two week lows as Wednesday’s session draws to a close. The move lower comes as the US Dollar finds renewed strength after the latest round of US data and the release of the FOMC Minutes. Next of note on the docket will be the US weekly Initial Jobless Claims.
 

GBP/USD reaches multi-day lows near 1.3500

GBP/USD reverses its initial upside momentum and is now adding to previous declines, approaching the 1.3500 region on Wednesday. Cable’s downtick comes on the back of decent gains in the Greenback and easing UK inflation figures, which seem to have reinforced the case for a BoE rate cut in March.

Gold battle to regain $5,000 continues

Gold is back on the front foot on Wednesday, shaking off part of the early week softness and challenging two-day highs near the $5,000 mark per troy ounce. The move comes ahead of the FOMC Minutes and is unfolding despite an intense rebound in the US Dollar.

Bitcoin has found or is near a bottom, extended consolidation to follow: K33

Bitcoin (BTC) is nearing or has already established a bottom, which could be followed by a sustained period of slow price movement, according to K33.

Mixed UK inflation data no gamechanger for the Bank of England

Food inflation plunged in January, but service sector price pressure is proving stickier. We continue to expect Bank of England rate cuts in March and June. The latest UK inflation read is a mixed bag for the Bank of England, but we doubt it drastically changes the odds of a March rate cut.

Sui extends sideways action ahead of Grayscale’s GSUI ETF launch

Sui is extending its downtrend for the second consecutive day, trading at 0.95 at the time of writing on Wednesday. The Layer-1 token is down over 16% in February and approximately 34% from the start of the year, aligning with the overall bearish sentiment across the crypto market.