|

EUR/USD Technical Analysis: Euro under pressure below 1.1400 figure
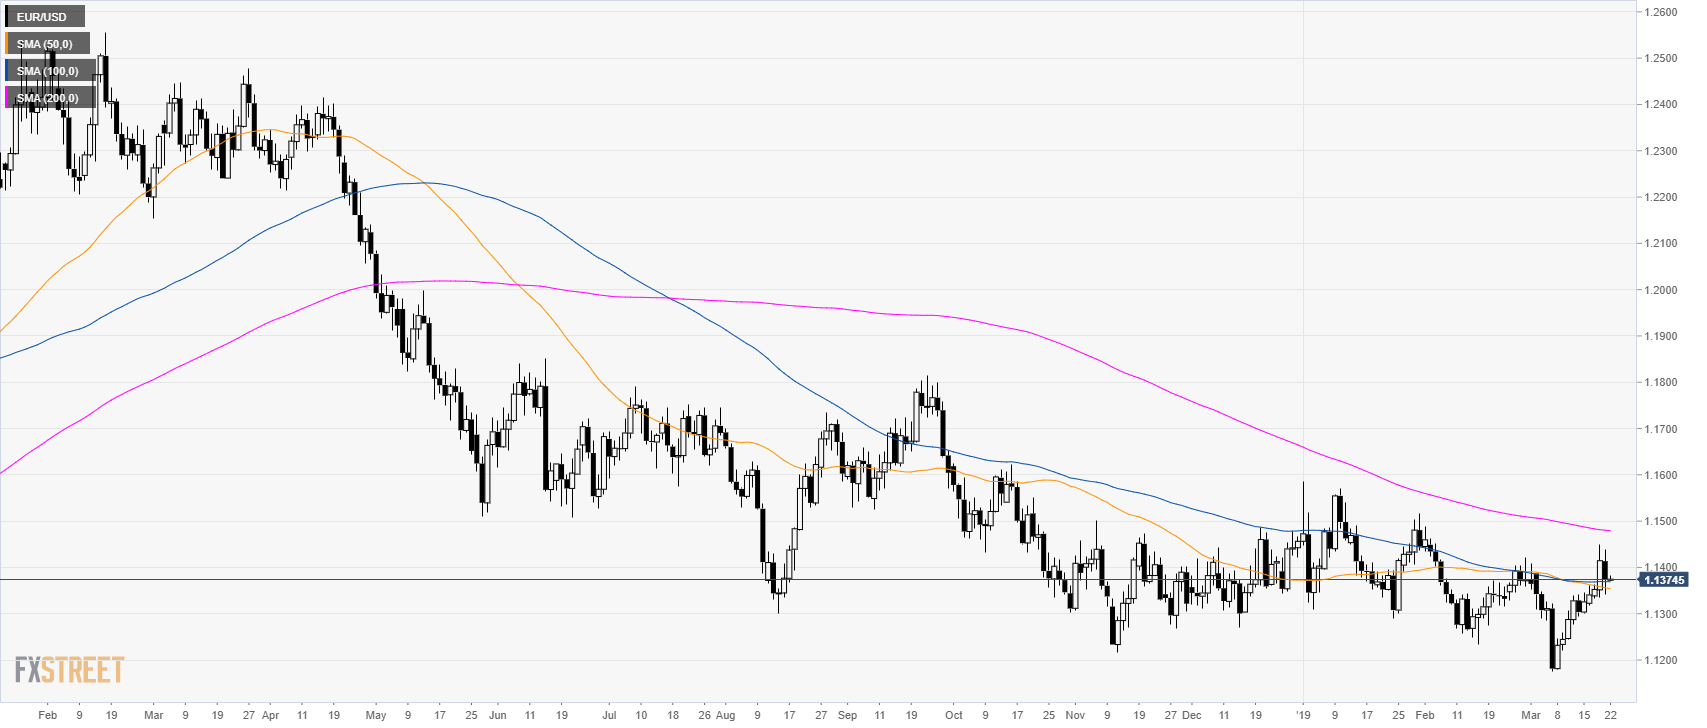
EUR/USD daily chart

  • EUR/USD is trading in a bear trend below its 200-day simple moving average (SMA).

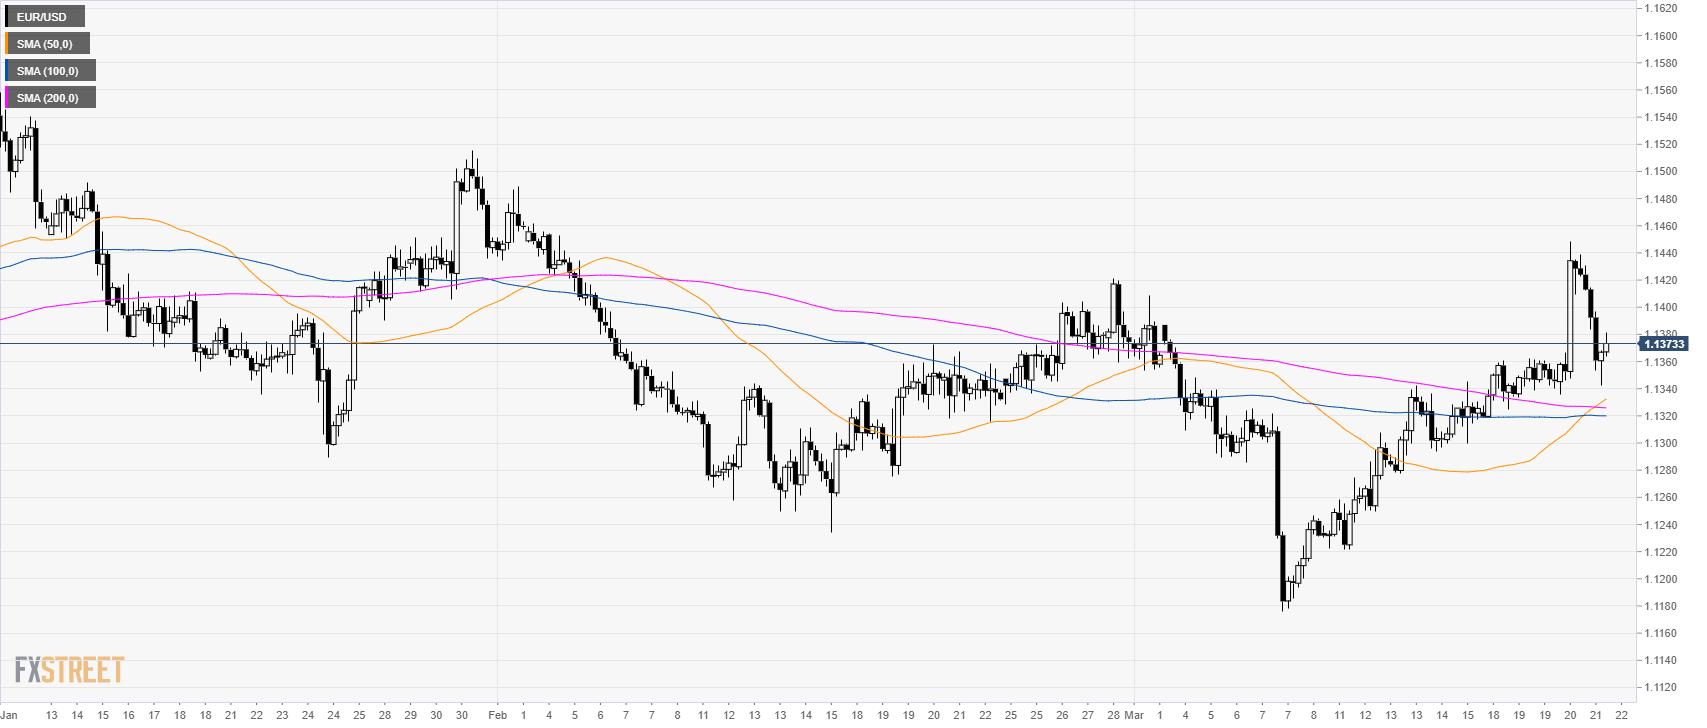
EUR/USD 4-hour chart
  • EUR/USD is trading above its main SMAs suggesting bullish momentum in the medium-term.

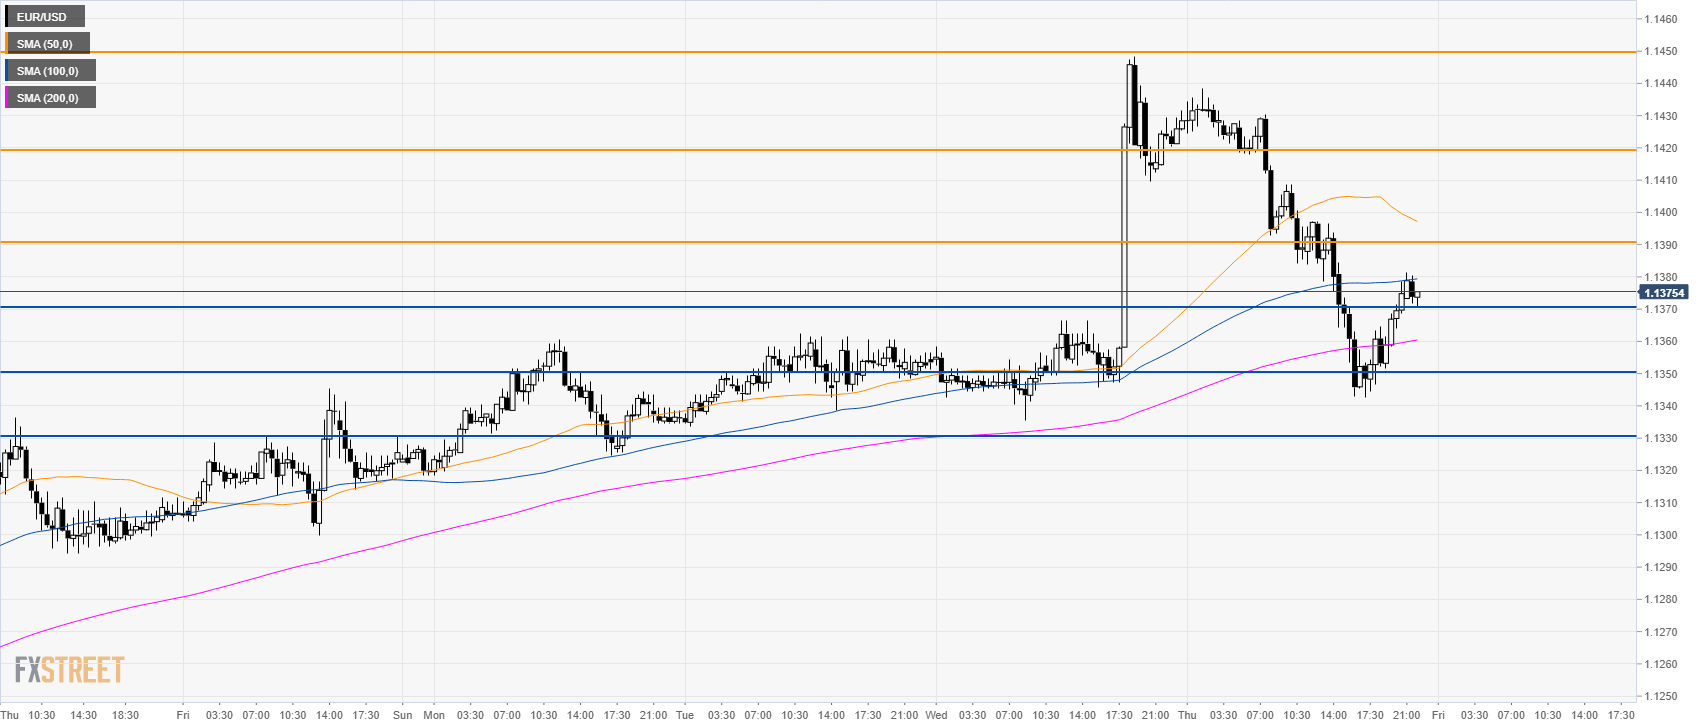
EUR/USD 30-minute chart

  • EUR/USD is trading between the 100 and 200 SMAs suggesting a consolidation phase in the short-term. 
  • Resistance is at 1.1390 and 1.1420. 
  • Support is at 1.1370, 1.1350 and 1.1330 level.

Additional key levels

EUR/USD

Overview
Today last price1.1374
Today Daily Change-0.0040
Today Daily Change %-0.35
Today daily open1.1414
 
Trends
Daily SMA201.1325
Daily SMA501.1358
Daily SMA1001.137
Daily SMA2001.1481
 
Levels
Previous Daily High1.1448
Previous Daily Low1.1336
Previous Weekly High1.1346
Previous Weekly Low1.1222
Previous Monthly High1.1489
Previous Monthly Low1.1234
Daily Fibonacci 38.2%1.1405
Daily Fibonacci 61.8%1.1379
Daily Pivot Point S11.1351
Daily Pivot Point S21.1287
Daily Pivot Point S31.1238
Daily Pivot Point R11.1464
Daily Pivot Point R21.1512
Daily Pivot Point R31.1576

Author

Flavio Tosti

Flavio Tosti

Independent Analyst


More from Flavio Tosti
Share:

Editor's Picks

EUR/USD stays well offered below 1.1800

The selling pressure on EUR/USD is picking up pace, with the pair slipping decisively below the key 1.1800 level and sliding to fresh two week lows as Wednesday’s session draws to a close. The move lower comes as the US Dollar finds renewed strength after the latest round of US data and the release of the FOMC Minutes. Next of note on the docket will be the US weekly Initial Jobless Claims.
 

GBP/USD reaches multi-day lows near 1.3500

GBP/USD reverses its initial upside momentum and is now adding to previous declines, approaching the 1.3500 region on Wednesday. Cable’s downtick comes on the back of decent gains in the Greenback and easing UK inflation figures, which seem to have reinforced the case for a BoE rate cut in March.

Gold battle to regain $5,000 continues

Gold is back on the front foot on Wednesday, shaking off part of the early week softness and challenging two-day highs near the $5,000 mark per troy ounce. The move comes ahead of the FOMC Minutes and is unfolding despite an intense rebound in the US Dollar.

Bitcoin has found or is near a bottom, extended consolidation to follow: K33

Bitcoin (BTC) is nearing or has already established a bottom, which could be followed by a sustained period of slow price movement, according to K33.

Mixed UK inflation data no gamechanger for the Bank of England

Food inflation plunged in January, but service sector price pressure is proving stickier. We continue to expect Bank of England rate cuts in March and June. The latest UK inflation read is a mixed bag for the Bank of England, but we doubt it drastically changes the odds of a March rate cut.

Sui extends sideways action ahead of Grayscale’s GSUI ETF launch

Sui is extending its downtrend for the second consecutive day, trading at 0.95 at the time of writing on Wednesday. The Layer-1 token is down over 16% in February and approximately 34% from the start of the year, aligning with the overall bearish sentiment across the crypto market.