|

EUR/USD technical analysis: Euro rolling into the Asian session below the 1.1050 level

  • EUR/USD is ending Thursday in the lower part of its daily range.
  • The level to beat for bears is the 1.1035 support.
  • As the market is in a range, EUR/USD is waiting for a catalyst.
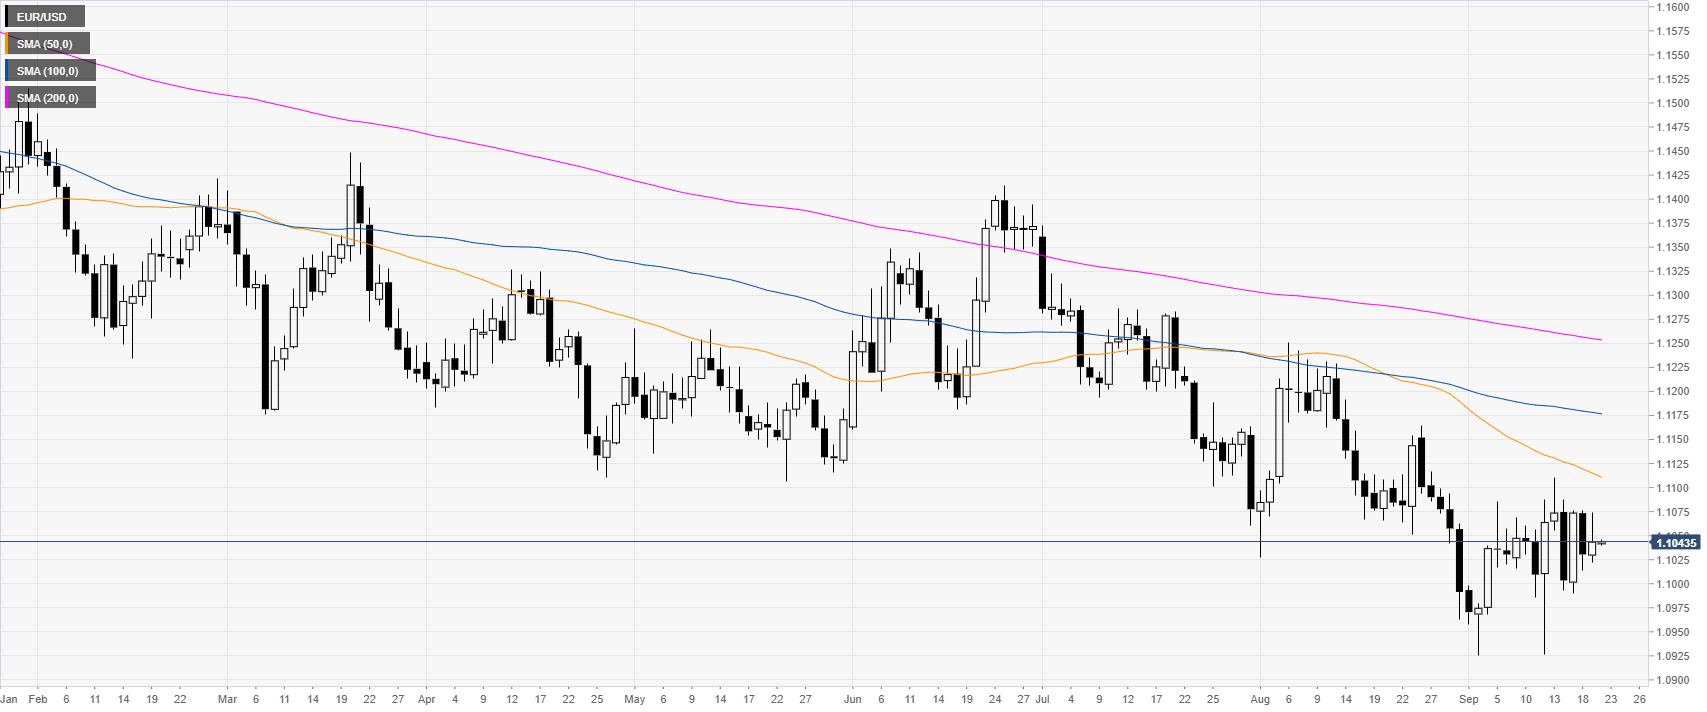
 

EUR/USD daily chart

 
The shared currency, on the daily chart, is trading in a bear trend below the main daily simple moving averages (DSMAs). The Euro has been in a trading range over the last two weeks as the market participants are waiting for a catalyst.

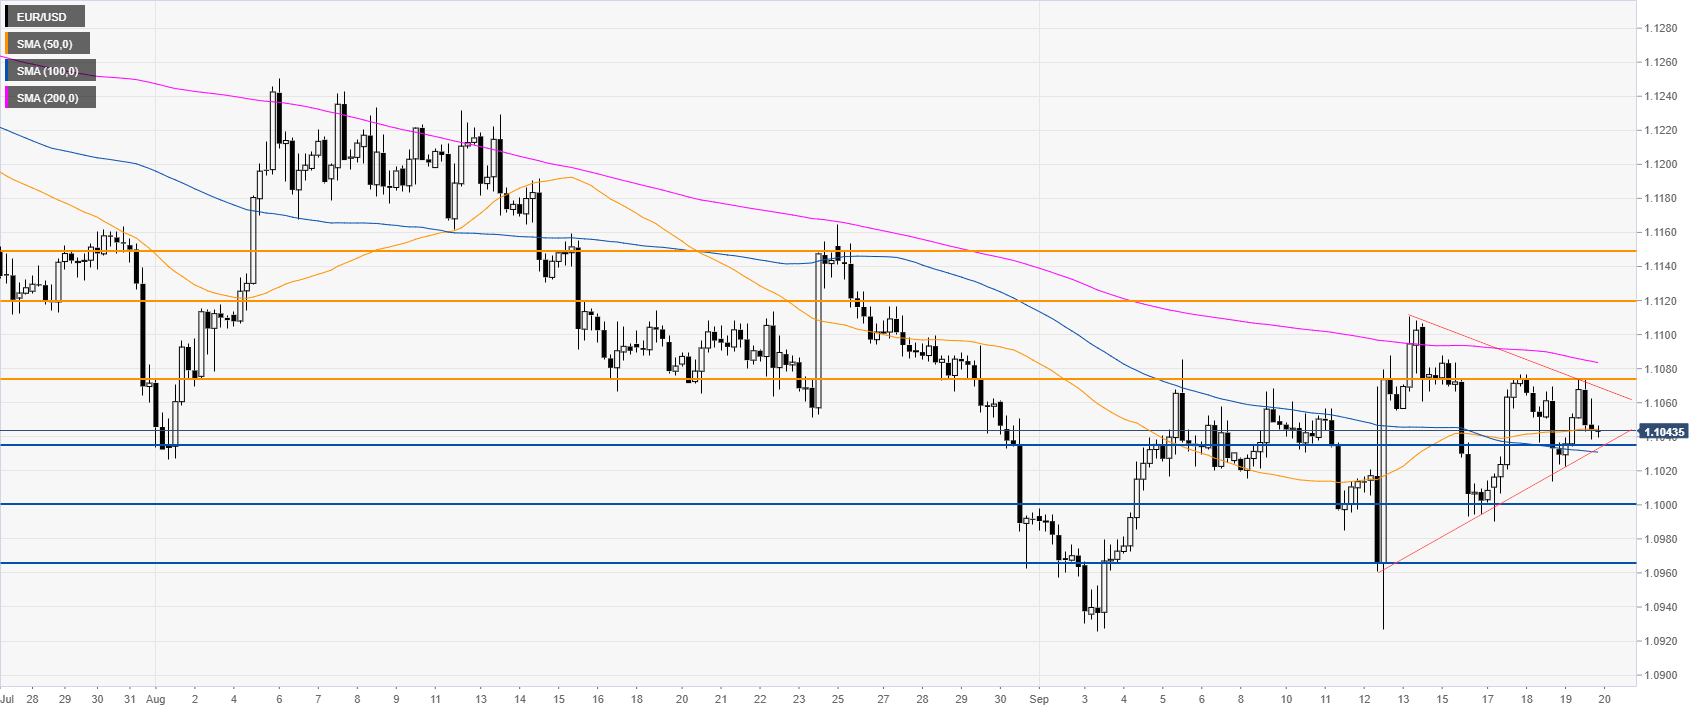
EUR/USD four-hour chart

 
EUR/USD is trading in a triangle pattern between the 100 and 200 SMA, suggesting a ranging market in the medium term. Euro is ending Thursday just above the 1.1035 support. A break below this level can lead to 1.1000 and 1.0965 to the downside, according to the Technical Confluences Indicator


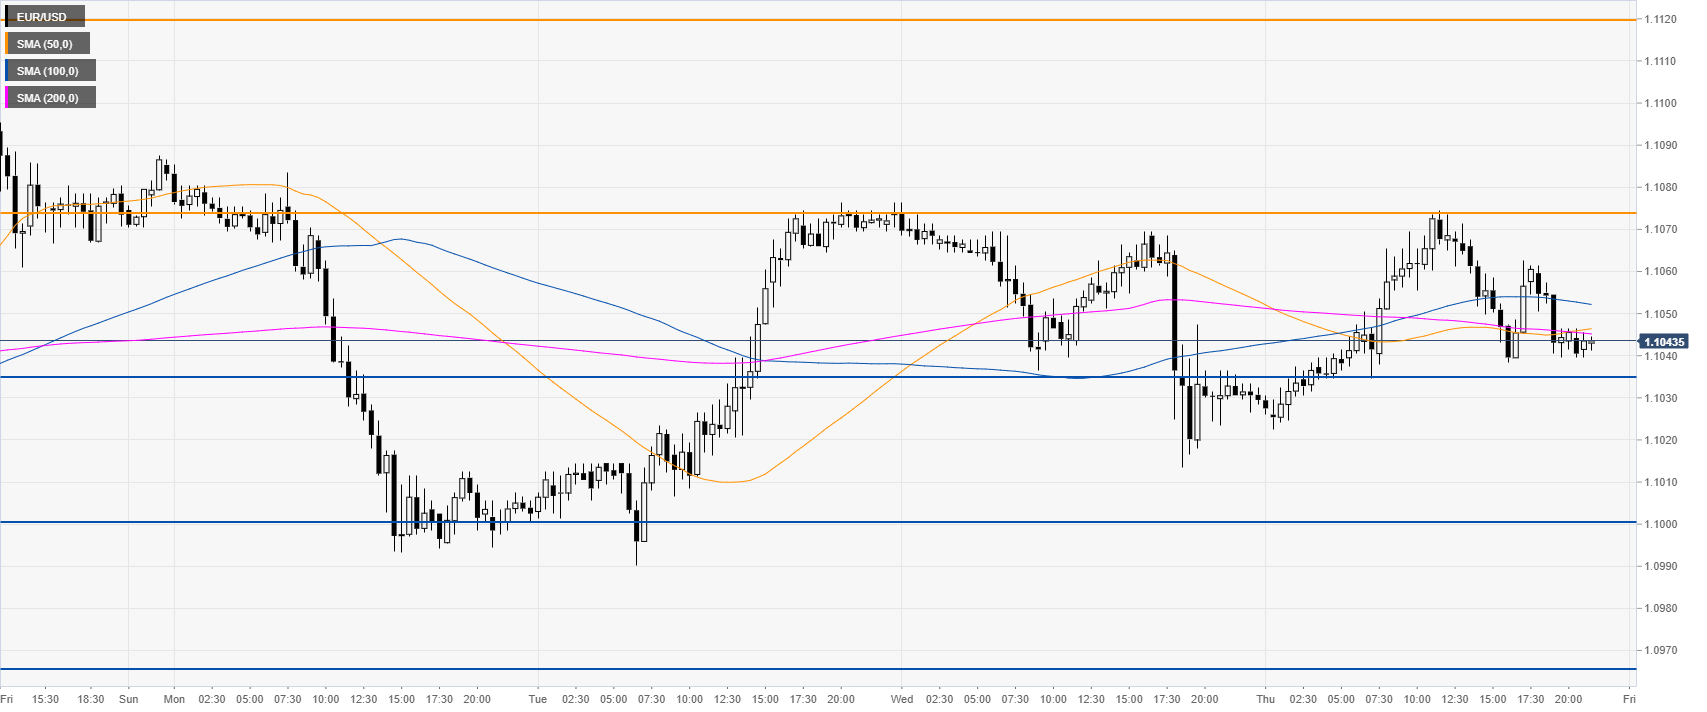
EUR/USD 30-minute chart

 
EUR/USD is entering the Asian session near its daily lows below its main SMAs. Resistances are seen at the 1.1074 and 1.1120 levels, according to the Technical Confluences Indicator.

Additional key levels

EUR/USD

Overview
Today last price1.1043
Today Daily Change0.0014
Today Daily Change %0.13
Today daily open1.1029
 
Trends
Daily SMA201.1047
Daily SMA501.1119
Daily SMA1001.118
Daily SMA2001.1256
 
Levels
Previous Daily High1.1075
Previous Daily Low1.1014
Previous Weekly High1.111
Previous Weekly Low1.0927
Previous Monthly High1.1251
Previous Monthly Low1.0962
Daily Fibonacci 38.2%1.1037
Daily Fibonacci 61.8%1.1051
Daily Pivot Point S11.1004
Daily Pivot Point S21.0978
Daily Pivot Point S31.0943
Daily Pivot Point R11.1065
Daily Pivot Point R21.11
Daily Pivot Point R31.1126

Author

Flavio Tosti

Flavio Tosti

Independent Analyst


More from Flavio Tosti
Share:

Editor's Picks

EUR/USD stays well offered below 1.1800

The selling pressure on EUR/USD is picking up pace, with the pair slipping decisively below the key 1.1800 level and sliding to fresh two week lows as Wednesday’s session draws to a close. The move lower comes as the US Dollar finds renewed strength after the latest round of US data and the release of the FOMC Minutes. Next of note on the docket will be the US weekly Initial Jobless Claims.
 

GBP/USD reaches multi-day lows near 1.3500

GBP/USD reverses its initial upside momentum and is now adding to previous declines, approaching the 1.3500 region on Wednesday. Cable’s downtick comes on the back of decent gains in the Greenback and easing UK inflation figures, which seem to have reinforced the case for a BoE rate cut in March.

Gold battle to regain $5,000 continues

Gold is back on the front foot on Wednesday, shaking off part of the early week softness and challenging two-day highs near the $5,000 mark per troy ounce. The move comes ahead of the FOMC Minutes and is unfolding despite an intense rebound in the US Dollar.

Bitcoin has found or is near a bottom, extended consolidation to follow: K33

Bitcoin (BTC) is nearing or has already established a bottom, which could be followed by a sustained period of slow price movement, according to K33.

Mixed UK inflation data no gamechanger for the Bank of England

Food inflation plunged in January, but service sector price pressure is proving stickier. We continue to expect Bank of England rate cuts in March and June. The latest UK inflation read is a mixed bag for the Bank of England, but we doubt it drastically changes the odds of a March rate cut.

Sui extends sideways action ahead of Grayscale’s GSUI ETF launch

Sui is extending its downtrend for the second consecutive day, trading at 0.95 at the time of writing on Wednesday. The Layer-1 token is down over 16% in February and approximately 34% from the start of the year, aligning with the overall bearish sentiment across the crypto market.