|

EUR/USD technical analysis: Euro on the back foot in the New York session, trading sub-1.1140 level

  • The Greenback is picking up some steam this Tuesday, sending EUR/USD to two-day lows.
  • Brexit uncertainties are weighing on both the market mood and the Euro. 
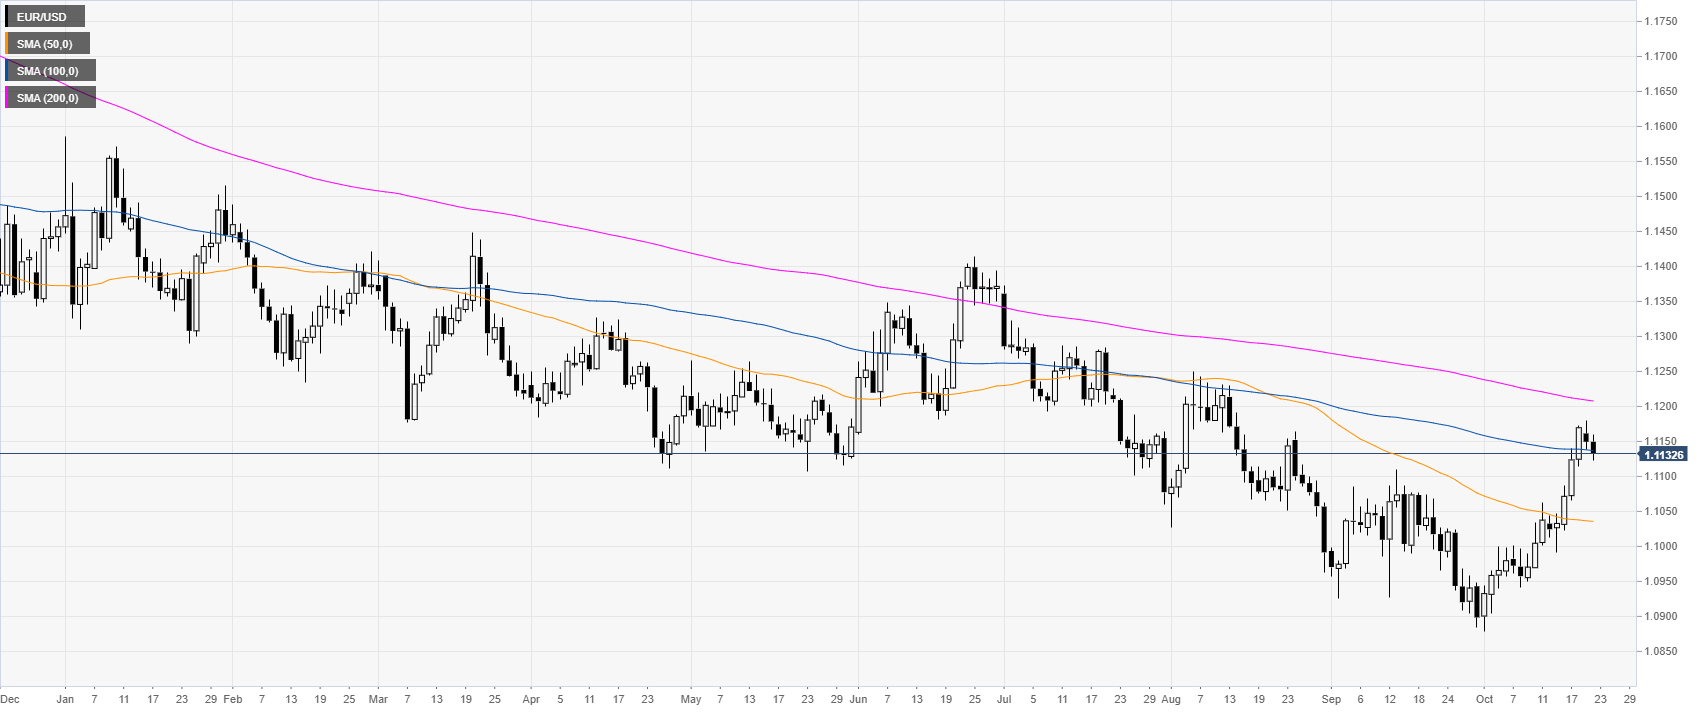
 

EUR/USD daily chart


On the daily chart, the shared currency is trading in a bear trend below its 200-day simple moving averages (DSMAs). However, the Brexit deal euphoria and the better market mood benefitted the Euro in October. 

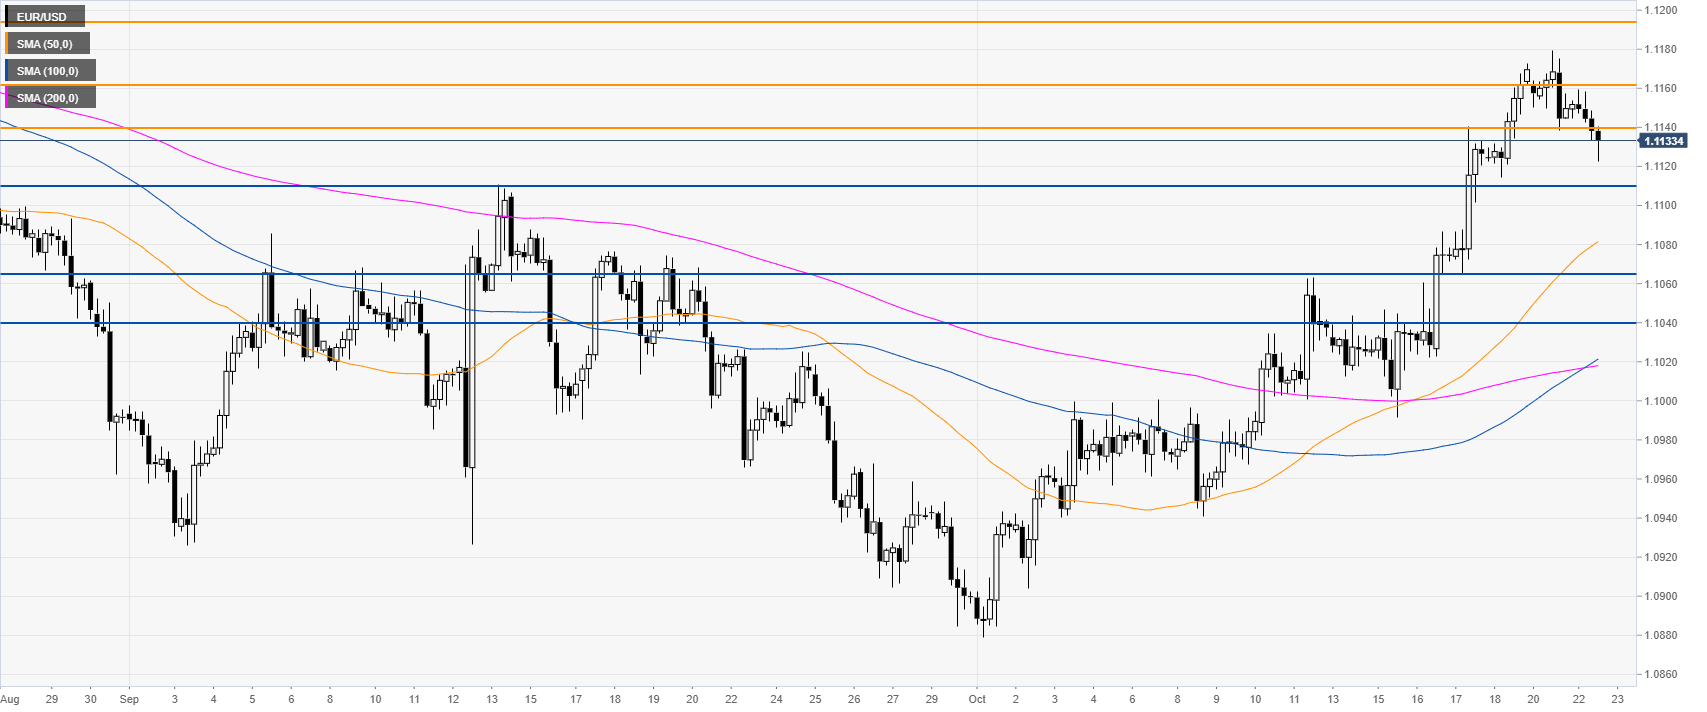
EUR/USD four-hour chart

 
On the four-hour chart, EUR/USD is starting to ease from the October highs, trading now below the 1.1140 resistance. However, the market is still above its main SMAs, suggesting bullish momentum in the medium term. A break of the 1.1160 resistance can lead to a move up to the 1.1191 resistance, according to the Technical Confluences Indicator.
 

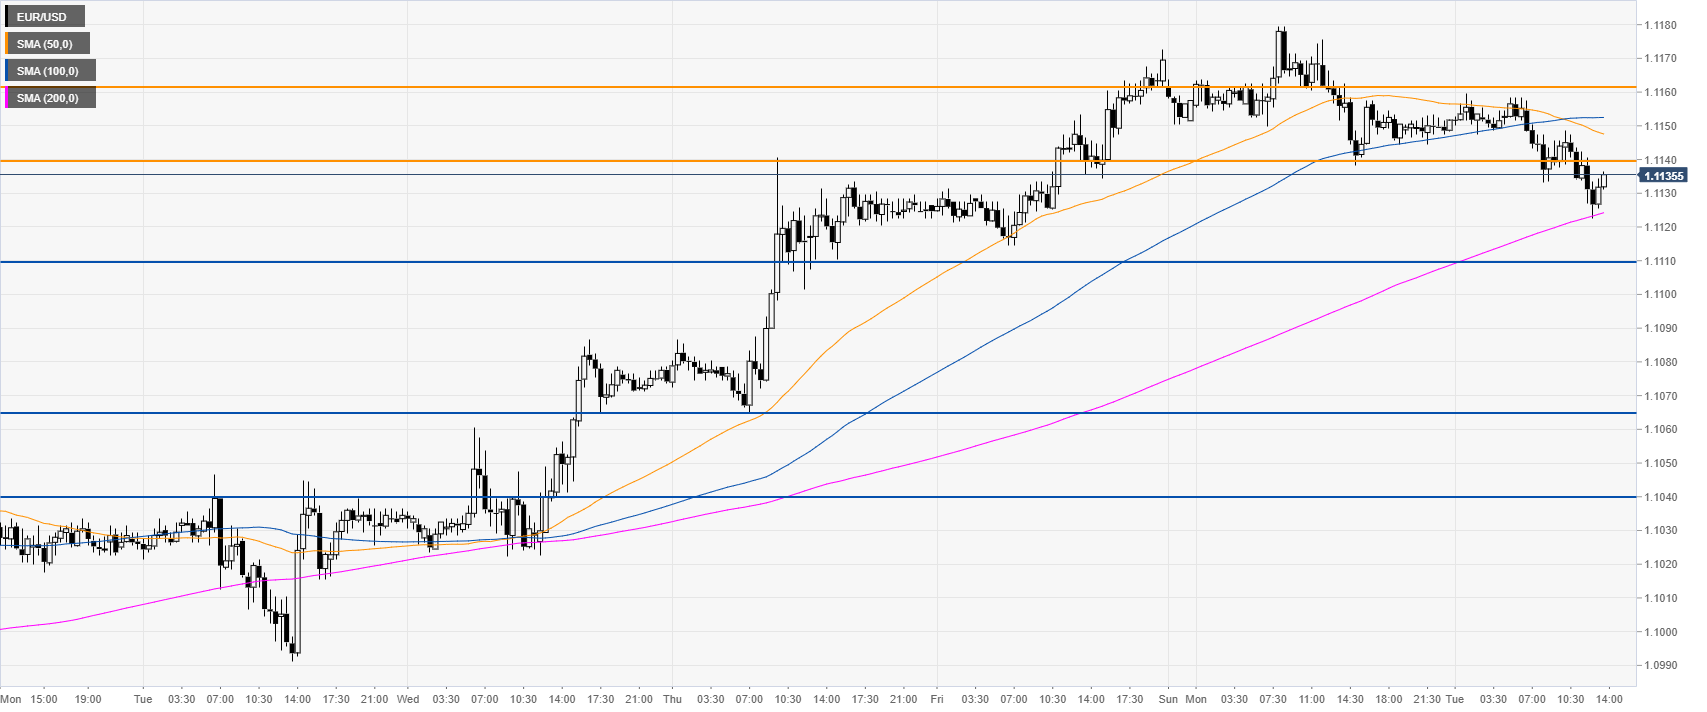
EUR/USD 30-minute chart


EUR/USD is trading below the 50 and 100 SMAs but above the 200 SMA, suggesting a consolidation in the near term. Bears would need to break 1.1110 to reach 1.1065 price level on the way down.
 

Additional key levels

EUR/USD

Overview
Today last price1.1132
Today Daily Change-0.0018
Today Daily Change %-0.16
Today daily open1.115
 
Trends
Daily SMA201.1006
Daily SMA501.1037
Daily SMA1001.1138
Daily SMA2001.1209
 
Levels
Previous Daily High1.118
Previous Daily Low1.1138
Previous Weekly High1.1063
Previous Weekly Low1.0941
Previous Monthly High1.111
Previous Monthly Low1.0885
Daily Fibonacci 38.2%1.1154
Daily Fibonacci 61.8%1.1164
Daily Pivot Point S11.1132
Daily Pivot Point S21.1115
Daily Pivot Point S31.1091
Daily Pivot Point R11.1173
Daily Pivot Point R21.1197
Daily Pivot Point R31.1215

Author

Flavio Tosti

Flavio Tosti

Independent Analyst


More from Flavio Tosti
Share:

Editor's Picks

EUR/USD looks to regain the 200-day SMA

EUR/USD regains some balance and trade just above 1.1600 the figure ahead of the opening bell in Asia. The pair initially dipped to the 1.1530 zone for the first time since November, always following the stronger US Dollar and the marked flight-to-safety in the context of the ongoing Middle East crisis
 

GBP/USD attacks 1.3300, refreshing three-month lows

GBP/USD is deep in the red near 1.3300, accelerating its downside to renew three-month lows in European trading on Tuesday. The ongoing escalation in the Iran war, combined with rising Oil prices, weighs negatively on the higher-yielding Pound Sterling as the US Dollar capitalizes on increased haven demand.

Gold bounces off lows, back above $5,100

Gold remains on the defensive, eroding part of the recent multi-day advance and managing to trade back above the $5,100 mark per troy ounce on Tuesday. The precious metal initially dropped just below the critical $5,000 threshold on the back of the persistent strength of the Greenback, higher US Treasury yields across the curve and investors' repricing of Fed rate cuts.

XRP risks extending losses as US-Iran war rages on

Ripple (XRP) has come under pressure, drifting lower to $1.35 at the time of writing on Tuesday. The over 2% correction looks poised to erase the previous day’s gains, which lifted the remittance token to $1.42.

Energy shock 2.0: Why rising Gas prices could hit the Euro

Even without a confirmed, sustained disruption, the mere risk to a key global energy chokepoint is enough to inject a significant premium into European Gas markets. And for the Euro, that matters.

Ripple falters amid sell-off jitters and negative funding rates

Ripple (XRP) has come under pressure, drifting lower to $1.35 at the time of writing on Tuesday. The over 2% correction looks poised to erase the previous day’s gains, which lifted the remittance token to $1.42.