|

EUR/USD technical analysis: Euro collapses to 2-year lows, sub-1.1000 level

  • EUR/USD falls to 2-year lows as the Greenback strengthens across the board. 
  • The level to beat for bears is the 1.1016 support followed by the 1.1039 level.
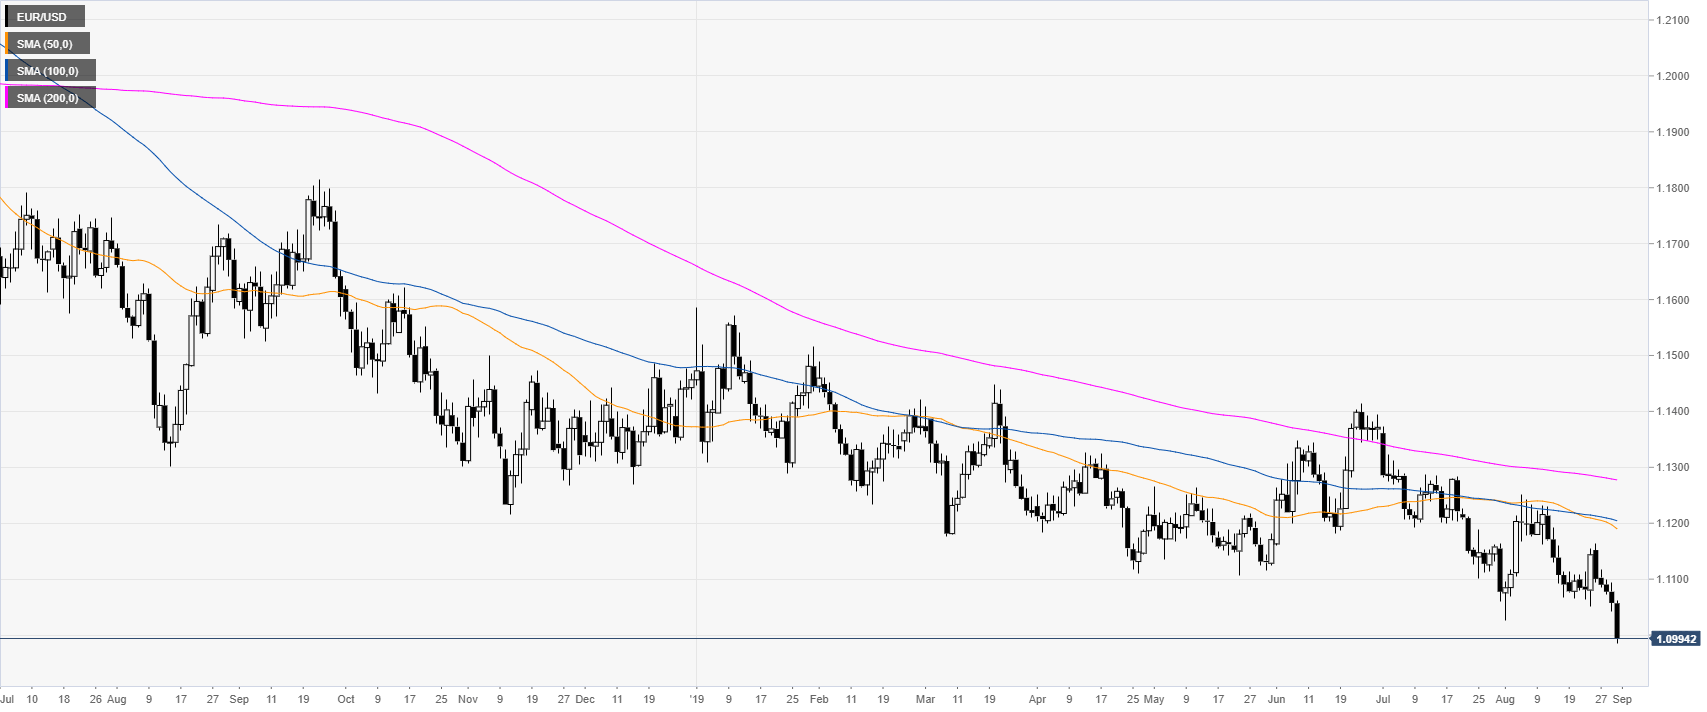


EUR/USD daily chart

 
On the daily time-frame, the shared currency is trading in a bear trend below the main daily simple moving averages (DSMAs). EUR/USD just broke to its lowest since 2017. 

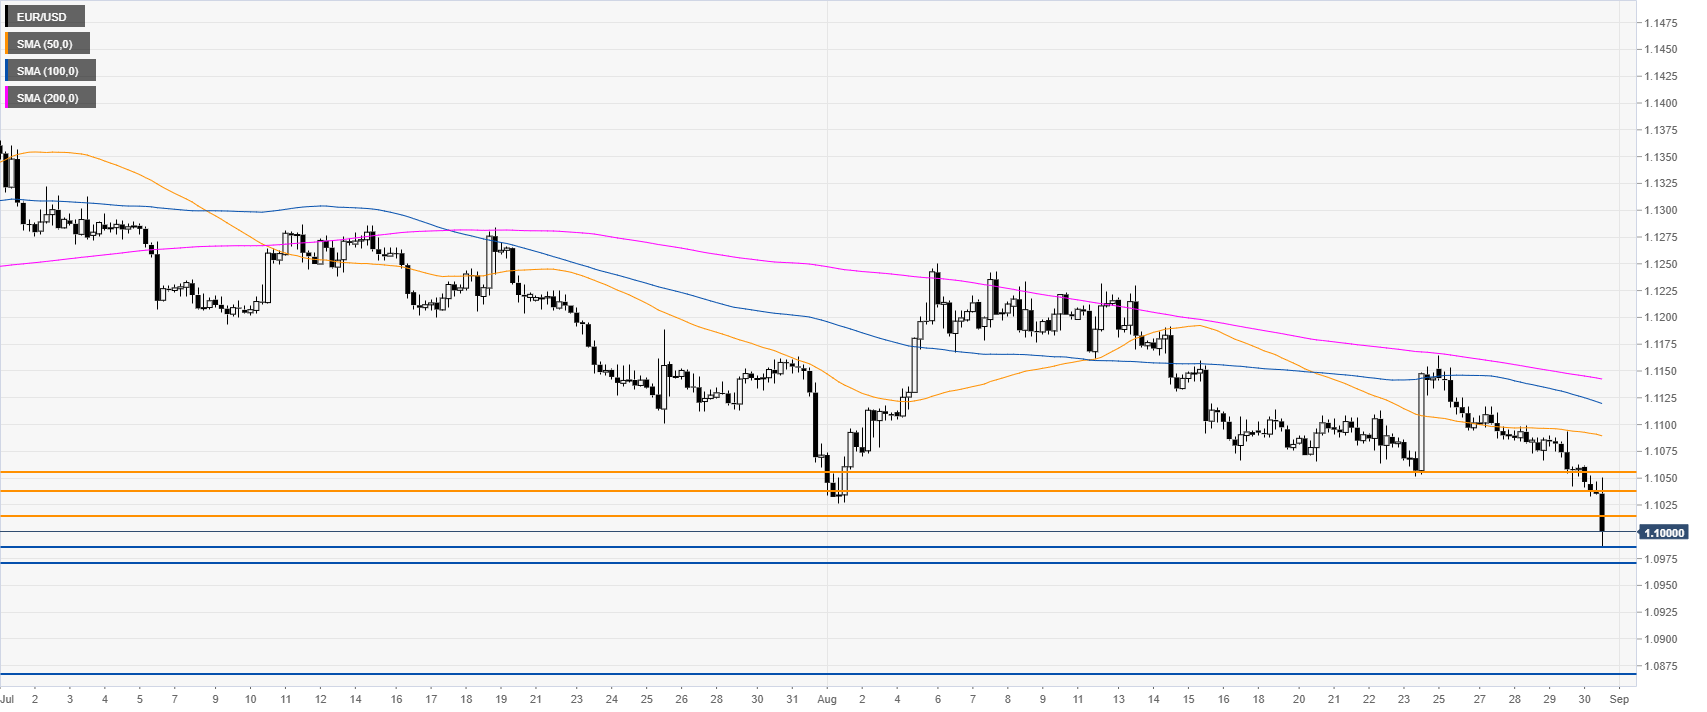
EUR/USD 4-hour chart

 
The bearish pressure is unabated as the market reached 2-year lows. The market is challenging the 1.1016 support while the next level is 1.1039. If broken, the market could precipitate towards 1.0870, according to the Technical Confluences Indicator.


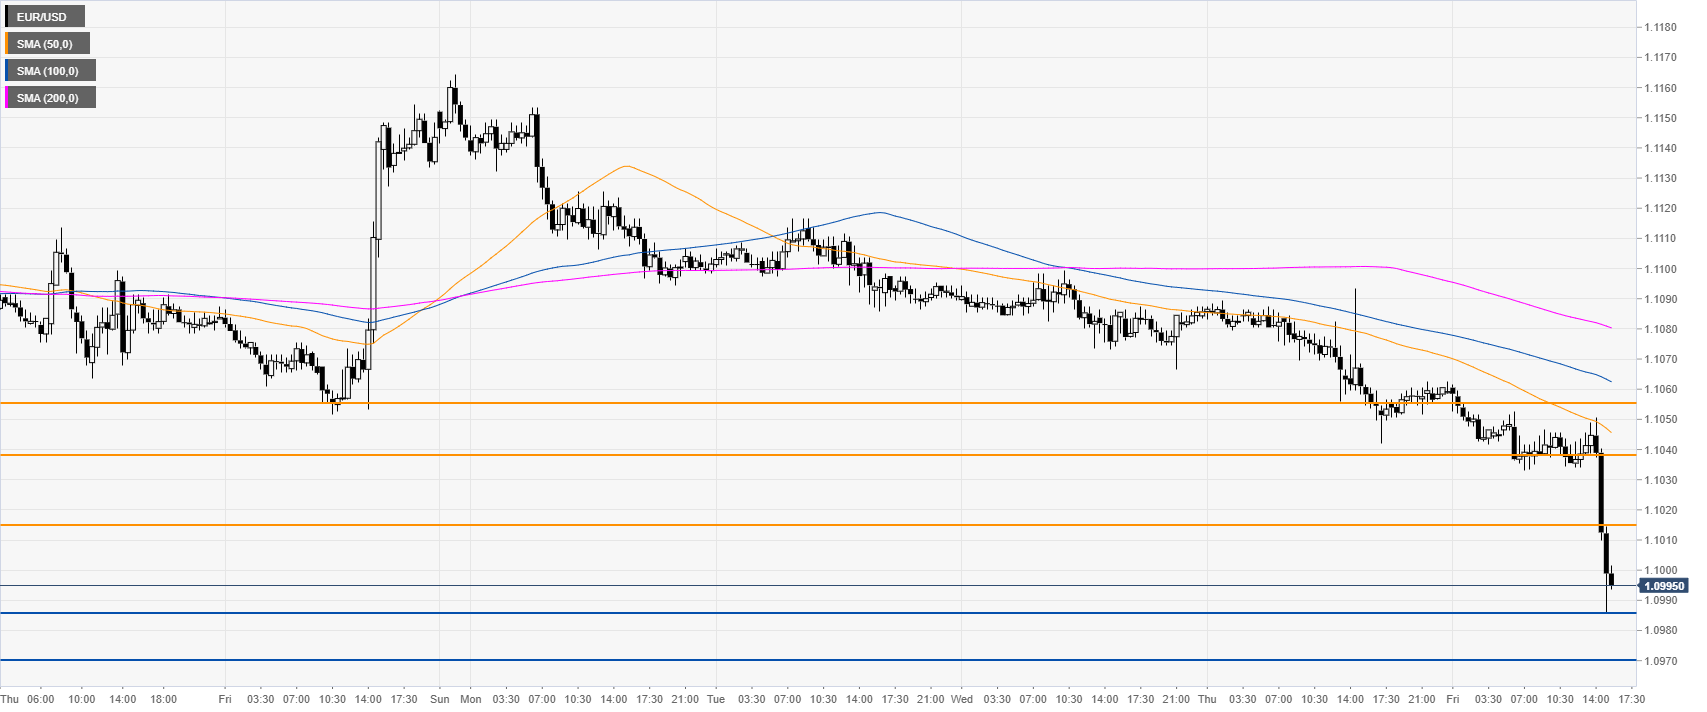
EUR/USD 30-minute chart

 
EUR/USD is trading below the main SMAs, suggesting a bearish momentum in the near term. Immediate resistances are seen at 1.1016, 1.1039 and 1.1056 levels, according to the Technical Confluences Indicator. 

Additional key levels

EUR/USD

Overview
Today last price1.0999
Today Daily Change-0.0059
Today Daily Change %-0.53
Today daily open1.1058
 
Trends
Daily SMA201.1131
Daily SMA501.1197
Daily SMA1001.1207
Daily SMA2001.1279
Levels
Previous Daily High1.1094
Previous Daily Low1.1042
Previous Weekly High1.1154
Previous Weekly Low1.1052
Previous Monthly High1.1373
Previous Monthly Low1.106
Daily Fibonacci 38.2%1.1062
Daily Fibonacci 61.8%1.1074
Daily Pivot Point S11.1035
Daily Pivot Point S21.1013
Daily Pivot Point S31.0984
Daily Pivot Point R11.1087
Daily Pivot Point R21.1116
Daily Pivot Point R31.1138

Author

Flavio Tosti

Flavio Tosti

Independent Analyst


More from Flavio Tosti
Share:

Editor's Picks

EUR/USD hovers around 1.1850 ahead of FOMC Minutes

EUR/USD stays on the back foot around 1.1850 in the European session on Wednesday, pressured by renewed US Dollar demand. Traders now look forward to the Minutes of the Fed's January monetary policy meeting for fresh signals on future rate cuts. 

GBP/USD defends 1.3550 after UK inflation data

GBP/USD is holding above 1.3550 in Wednesday's European morning, little changed following the UK Consumer Price Index (CPI) data release. The UK inflation eased as expected in January, reaffirming bets for a March BoE interest rate cut, especially after Tuesday's weak employment report. 

Gold: Is the $5,000 level back in sight?

Gold snaps a two-day downtrend, as recovery gathers traction toward $5,000 on Wednesday. The US Dollar recovers from the overnight sell-off as rebalancing trades resume ahead of Fed Minutes. The 38.2% Fib support holds on the daily chart for now. What does that mean for Gold?

Pi Network rally defies market pressure ahead of its first anniversary

Pi Network is trading above $0.1900 at press time on Wednesday, extending the weekly gains by nearly 8% so far. The steady recovery is supported by a short-term pause in mainnet migration, which reduces pressure on the PI token supply for Centralized Exchanges. The technical outlook focuses on the $0.1919 resistance as bullish momentum increases.

UK jobs market weakens, bolstering rate cut hopes

In the UK, the latest jobs report made for difficult reading. Nonetheless, this represents yet another reminder for the Bank of England that they need to act swiftly given the collapse in inflation expected over the coming months. 

Top 3 Price Prediction: Bitcoin, Ethereum, and Ripple face downside risk as bears regain control

Bitcoin, Ethereum, and Ripple remain under pressure on Wednesday, with the broader trend still sideways. BTC is edging below $68,000, nearing the lower consolidating boundary, while ETH and XRP also declined slightly, approaching their key supports.