|

EUR/USD technical analysis: Euro clings to daily gains into the London close

  • The US ISM Non-Manufacturing PMI dropped to 52.6 vs. 55 forecast and EUR/USD rose to the 1.1000 figure.
  • The level to beat for buyers is the 1.1000 handle followed by the 1.1030 price level.
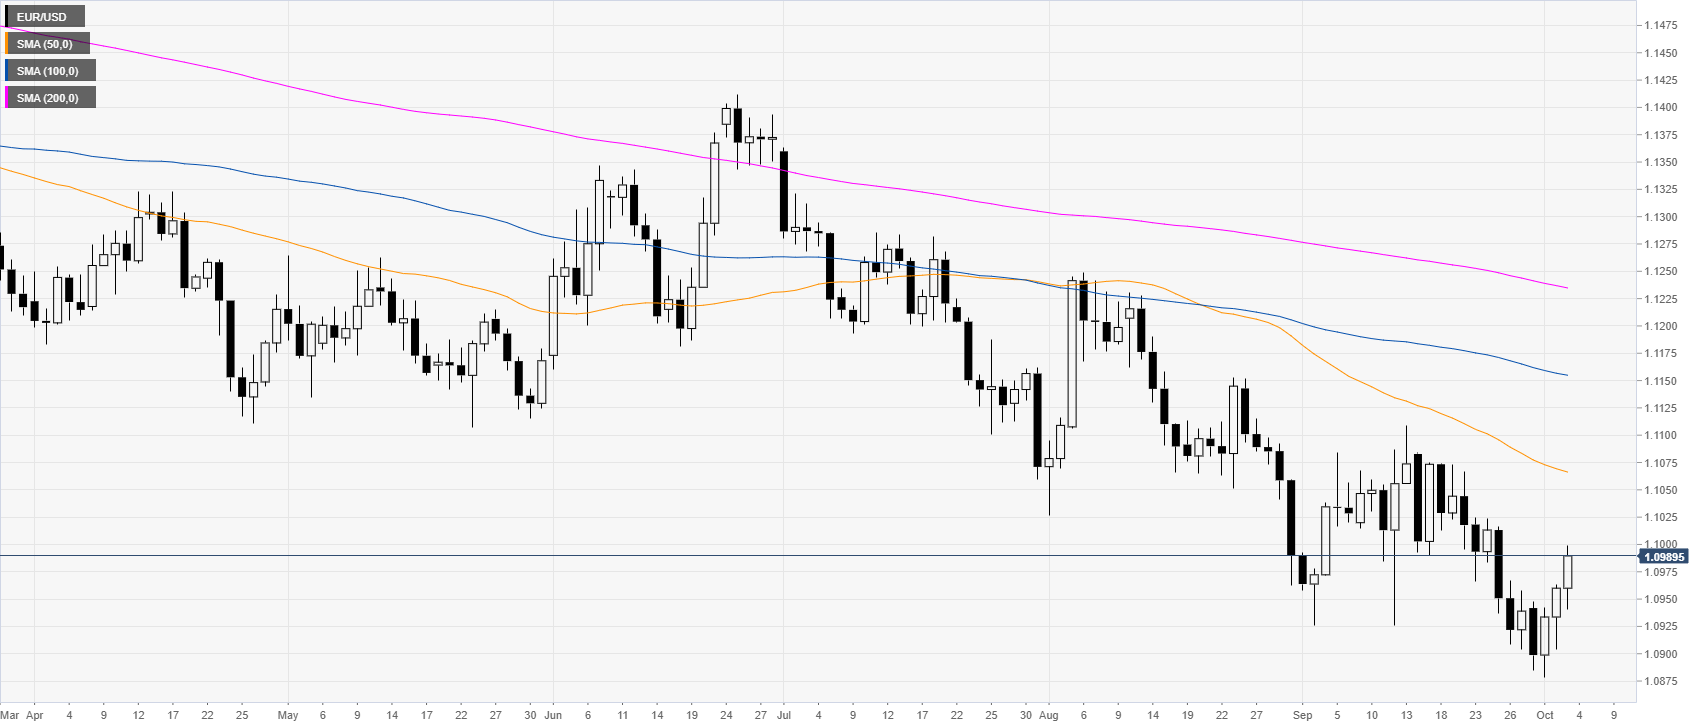
 

EUR/USD daily chart

 
The common currency, on the daily chart, is trading in a bear trend below its main daily simple moving averages (DSMAs). EUR/USD is advancing as the US ISM Non-Manufacturing PMI dropped to 52.6 in September vs. 55 forecast.


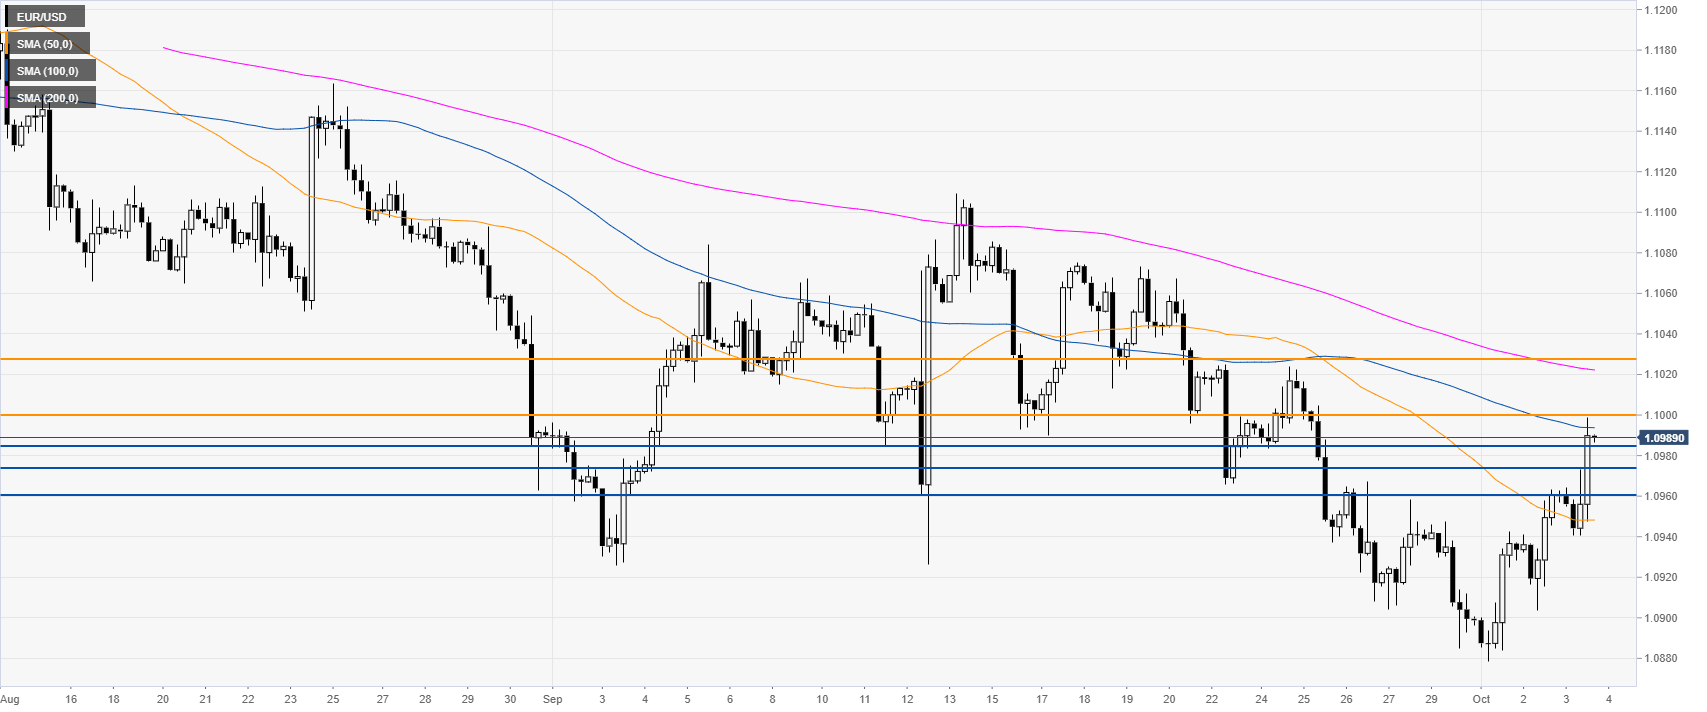
EUR/USD four-hour chart

 
EUR/USD broke above the 1.0960 resistance and is now challenging the 1.1000 handle and the 100 SMA. A break above 1.1000 can lead to the 1.1030 resistance, according to the Technical Confluences Indicator.


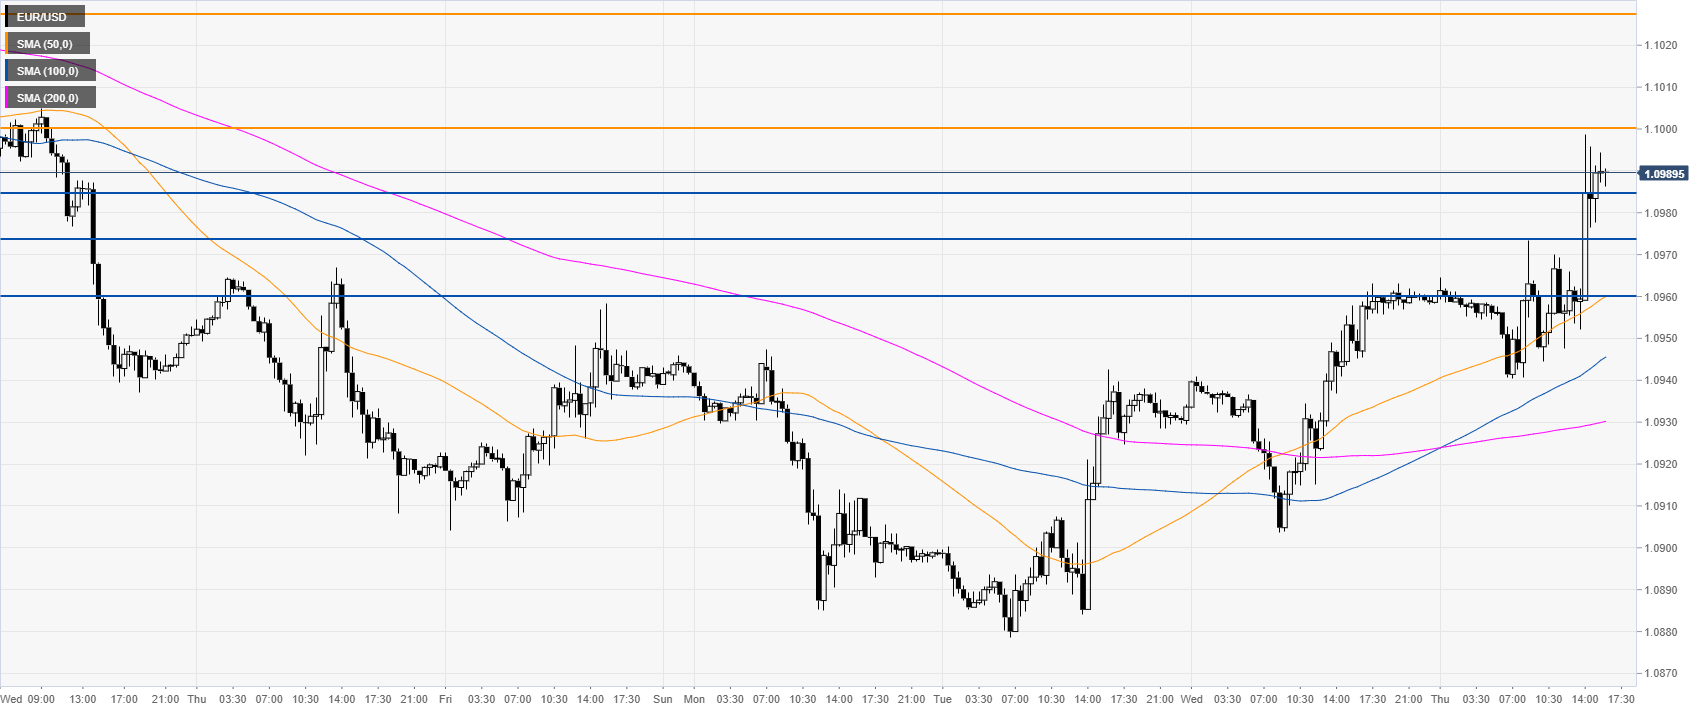
EUR/USD 30-minute chart


EUR/USD is trading above its main SMAs, suggesting bullish momentum in the near term. Immediate support is seen at the 1.0985, 1.0974 and 1.0960 price levels, according to the Technical Confluences Indicator. 


Additional key levels

EUR/USD

Overview
Today last price1.099
Today Daily Change0.0030
Today Daily Change %0.27
Today daily open1.096
 
Trends
Daily SMA201.1004
Daily SMA501.1069
Daily SMA1001.1156
Daily SMA2001.1236
 
Levels
Previous Daily High1.0964
Previous Daily Low1.0904
Previous Weekly High1.1026
Previous Weekly Low1.0905
Previous Monthly High1.111
Previous Monthly Low1.0885
Daily Fibonacci 38.2%1.0941
Daily Fibonacci 61.8%1.0927
Daily Pivot Point S11.0922
Daily Pivot Point S21.0883
Daily Pivot Point S31.0862
Daily Pivot Point R11.0981
Daily Pivot Point R21.1002
Daily Pivot Point R31.1041

Author

Flavio Tosti

Flavio Tosti

Independent Analyst


More from Flavio Tosti
Share:

Editor's Picks

EUR/USD seems fragile below 1.1700 as Middle East war boosts energy prices

The EUR/USD pair trades flat at around 1.1680 during the Asian trading session on Tuesday, but broadly seems vulnerable, being close to its five-week low. The major currency pair is under pressure as surging oil prices due to the United States-Israel war with Iran have increased the risks of higher inflation for the Old Continent.

GBP/USD hovers around 1.3400 with bearish pressure intact

GBP/USD edges higher after three days of losses, trading around 1.3400 during the Asian hours on Tuesday. The technical analysis of the daily chart indicates an ongoing bearish bias, as the pair trades within a descending channel pattern.

Gold weakens below $5,300 as sustained USD buying counter Middle East tensions

Gold attracts some intraday selling and falls around $100 from the daily top, around the $5,380 area. The US Dollar climbs to a fresh high since January 20 and turns  out to be a key factor exerting downward pressure on the commodity. However, concerns about a broader regional conflict in the Middle East continue to weigh on investors' sentiment and underpin demand for the traditional safe-haven bullion.

Stellar risks deeper losses as derivatives metrics turn negative

Stellar is trading red below $0.16 at the time of writing on Tuesday, after a slight recovery the previous day. Weakening derivatives data caps the recovery, while an unfavorable technical outlook projects a deeper correction for the XLM token in the upcoming days.

The market is not panicking it is repricing the probability distribution of Oil and time

At the end of the day, markets do not trade morality or geopolitics. They trade transmission channels. And the only channel that truly matters in this maelstrom runs through the price of energy and the time value of money.

Hyperliquid Price Forecast: HYPE rises on commodities demand amid US-Iran war

Hyperliquid (HYPE) steadies above $33 at press time on Tuesday, marking its fourth consecutive day of recovery in a broadly volatile market due to the ongoing US-Israel strikes on Iran.