|

EUR/USD Technical Analysis: Euro at daily highs breaking above 1.1300 figure
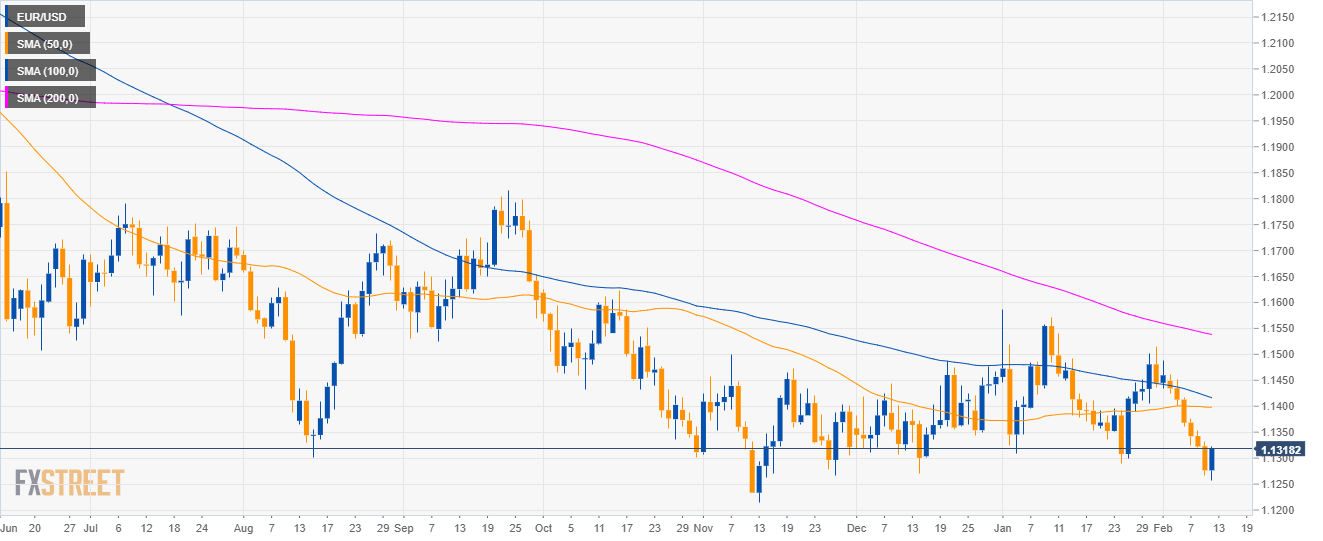
EUR/USD daily chart

  • EUR/USD is trading in a bear trend below the 200-day simple moving average (SMA).

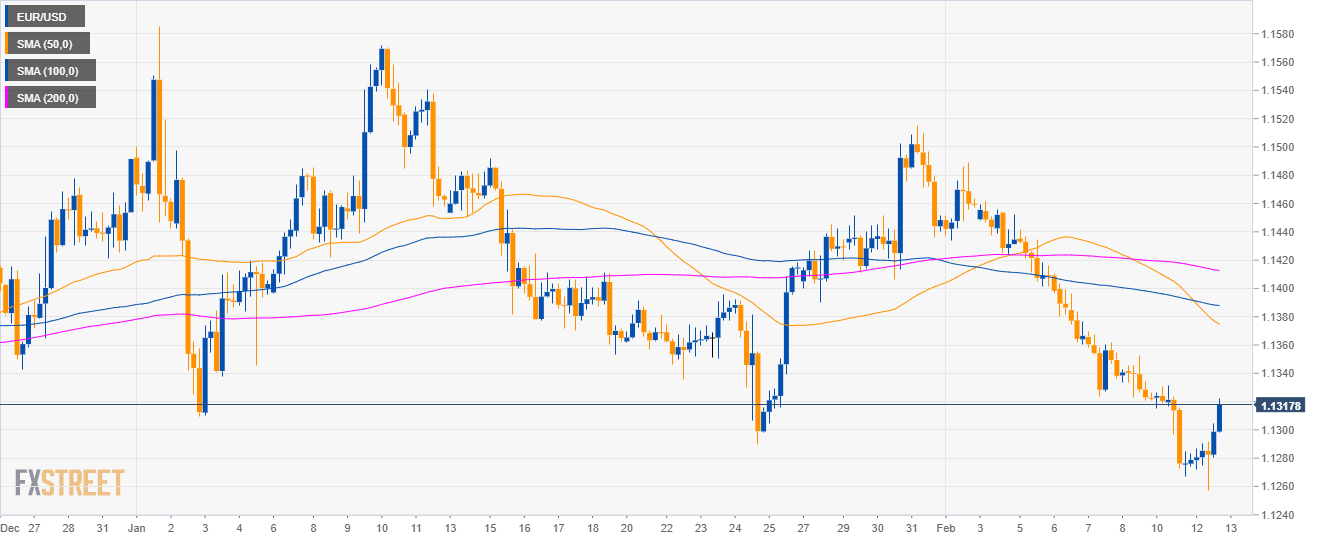
EUR/USD 4-hour chart

  • EUR/USD is trading below its main SMAs suggesting bearish momentum in the medium-term.

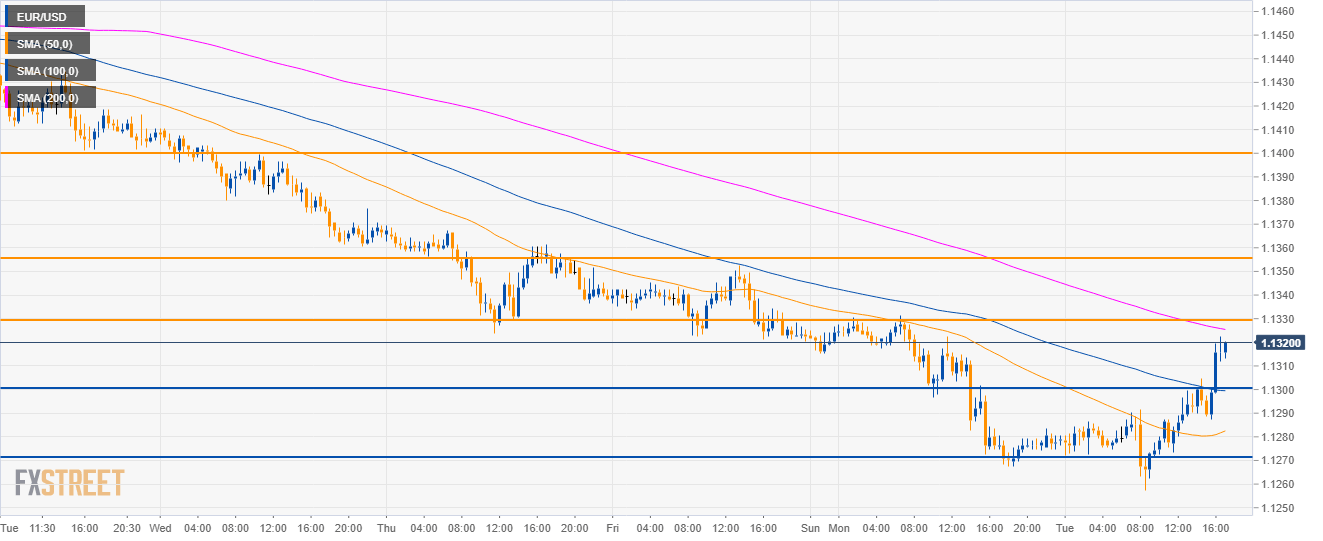
EUR/USD 30-minute chart

  • EUR/USD reclaimed the 1.1300 figure as the market is trading above its 50 and 100 SMA while bulls are challenging the 200 SMA.
  • A break of 1.1330 could lead to a move up to 1.1355 and 1.1400 in the medium-term. 
  • To the downside, support is seen at 1.1300 and 1.1270. 

Additional key levels

EUR/USD

Overview:
    Today Last Price: 1.1317
    Today Daily change: 41 pips
    Today Daily change %: 0.36%
    Today Daily Open: 1.1276
Trends:
    Daily SMA20: 1.139
    Daily SMA50: 1.1398
    Daily SMA100: 1.1421
    Daily SMA200: 1.1541
Levels:
    Previous Daily High: 1.1332
    Previous Daily Low: 1.1267
    Previous Weekly High: 1.1462
    Previous Weekly Low: 1.132
    Previous Monthly High: 1.1586
    Previous Monthly Low: 1.1289
    Daily Fibonacci 38.2%: 1.1292
    Daily Fibonacci 61.8%: 1.1307
    Daily Pivot Point S1: 1.1252
    Daily Pivot Point S2: 1.1228
    Daily Pivot Point S3: 1.1188
    Daily Pivot Point R1: 1.1316
    Daily Pivot Point R2: 1.1356
    Daily Pivot Point R3: 1.138

Author

Flavio Tosti

Flavio Tosti

Independent Analyst


More from Flavio Tosti
Share:

Editor's Picks

EUR/USD looks weak below 1.1800

EUR/USD has slipped back under pressure, breaking through the 1.1800 support and drifting towards the weekly lows near 1.1770 ahead of the opening bell in Asia. The move reflects renewed strength in the US Dollar, with steady geopolitical tensions keeping its demand firm. Moving forward, the release of the German labour market report and flash inflation figures should keep European investors entertained on Friday.
 

GBP/USD threatens the 200-day SMA near 1.3440

GBP/USD rapidly leaves behind Wednesday’s strong advance, coming under heavy pressure and retesting the 1.3440 zone, where the critical 200-day SMA is located. Cable’s deep pullback follows the strong gains in the Greenback, while investors continue to pencil in a potential BoE rate cut in March.

Gold remains below $5,200 despite tariff jitters and geopolitical risks

Gold is seen consolidating in a range below the $5,200 mark during the Asian session on Friday amid mixed cues. Trade jitters, along with the risk of a potential US-Iran war, act as a tailwind for the safe-haven bullion. Meanwhile, the Fed's hawkish outlook keeps the US Dollar close to the monthly high and caps the non-yielding yellow metal. Nevertheless, the commodity remains on track to register gains for the fourth straight week, though the fundamental backdrop warrants some caution for bullish traders.

How AI, blockchain, stablecoins are shaping a new global economy – Circle CEO Jeremy Allaire

Artificial Intelligence (AI), blockchain technology and stablecoins are emerging as core pillars of a new global economic system, according to Circle’s CEO, Jeremy Allaire.

Changing the game: International implications of recent tariff developments

The Supreme Court ruling on International Emergency Economic Powers Act (IEEPA) tariffs provides limited relief for the rest of the world, with weighted average tariff rates modestly lower.

Bitcoin steadies as traders eye US–Iran talks

Bitcoin (BTC) price is stabilizing around $68,000 at the time of writing on Thursday after a 6.2% relief rally the previous day amid a broader downward trend.