|

EUR/USD Price Analysis: Surges eyeing a test of the 50-DMA

  • The EUR/USD rises close to 1% after a lower-than-expected US inflation report.
  • The shared currency failed to crack the 50-DMA early in the New York session.
  • From a long-term perspective, the pair is neutral-to-downward, but the one-hour chart keeps buyers hopeful once they clear 1.0344.

The EUR/USD rallies towards the 50-day EMA, reaching a five-week high of around 1.0366, amidst an upbeat sentiment, courtesy of lower-than-estimated US inflation. That, alongside investors’ scaling back odds of a 75 bps rate hike by the Fed, spurred a risk on reaction, with US equities soaring. At the time of writing, the EUR/USD is trading at 1.0303. up by almost 1%.

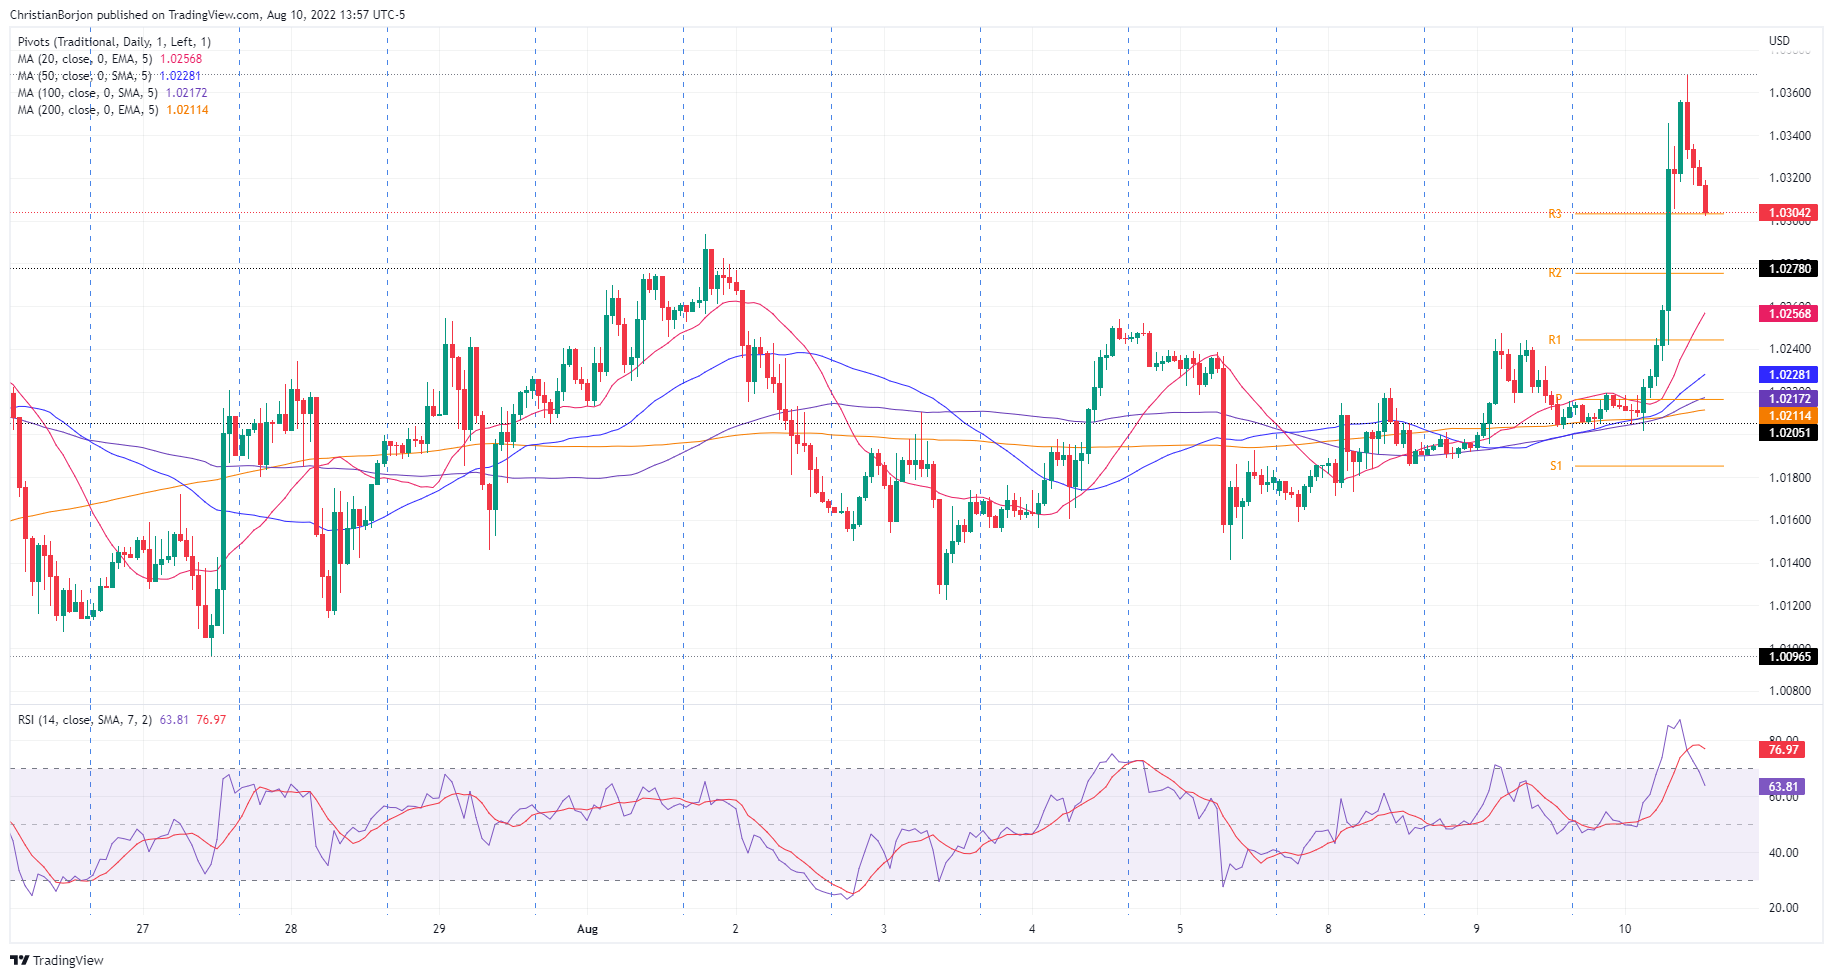
EUR/USD Price Analysis: Technical outlook

From a daily chart perspective, the EUR/USD is still neutral to downward biased. However, buyers are gathering momentum, as shown by the Relative Strength Index, decisively breaking above the 50-midline for the first time since June 8, signaling buyers are stepping in. Nevertheless, sellers would get the upper hand until buyers reclaim the 50-day EMA at 1.0344.

In the one-hour time-frame, the EUR/USD rally appears to be losing steam, at the daily high at 1.0368, with the major retreating towards current price levels, at the R3 daily pivot. The fall might be attributed to the Relative Strength Index (RSI), which advanced sharply towards overbought territory at 87 before exiting and sits at 64 as buyers take a breather. Therefore, the pair is upward biased in the near term.

Upwards, the EUR/USD’s first resistance would be the August 10 high at 1.0368. Once cleared, the next supply zone would be the 1.0400 figure, followed by the July 4 daily high at 1.0445.

EUR/USD Hourly chart

EUR/USD Key Technical Levels


Overview
Today last price1.0311
Today Daily Change0.0098
Today Daily Change %0.96
Today daily open1.0213
 
Trends
Daily SMA201.0176
Daily SMA501.0353
Daily SMA1001.0546
Daily SMA2001.0915
 
Levels
Previous Daily High1.0248
Previous Daily Low1.0188
Previous Weekly High1.0294
Previous Weekly Low1.0123
Previous Monthly High1.0486
Previous Monthly Low0.9952
Daily Fibonacci 38.2%1.0225
Daily Fibonacci 61.8%1.0211
Daily Pivot Point S11.0185
Daily Pivot Point S21.0157
Daily Pivot Point S31.0126
Daily Pivot Point R11.0244
Daily Pivot Point R21.0275
Daily Pivot Point R31.0303

Author

Christian Borjon Valencia

Markets analyst, news editor, and trading instructor with over 14 years of experience across FX, commodities, US equity indices, and global macro markets.

More from Christian Borjon Valencia
Share:

Editor's Picks

EUR/USD hits fresh 2026 lows near 1.1570

EUR/USD adds to Monday’s heavy losses and reaches new yearly lows around 1.1570 on Tuesday. The pair’s deep pullback comes as the US Dollar extend its strong bounce, always propped up by the intense flight-to-safety environment amid the deteriorating geopolitical landscape in the Middle East.

GBP/USD attacks 1.3300, refreshing three-month lows

GBP/USD is deep in the red near 1.3300, accelerating its downside to renew three-month lows in European trading on Tuesday. The ongoing escalation in the Iran war, combined with rising Oil prices, weighs negatively on the higher-yielding Pound Sterling as the US Dollar capitalizes on increased haven demand.

Gold drops further, threatens $5,000

Gold comes under renewed and marked selling pressure on Tuesday, dangerously approaching the critical $5,000 mark per troy ounce, reversing at the same time four consecutive daily advances. The yellow metal’s bearish tone comes on the back of the increasing demand for the Greenback and investors’ repricing of Fed rate cuts.

Crypto Today: Bitcoin, Ethereum, XRP pull back as sentiment remains in extreme market fear

The cryptocurrency market is broadly in the red on Tuesday as the Middle East grapples with an escalating war. Bitcoin (BTC) is in a pullback, trading below $67,000 at the time of writing, and most altcoins follow suit.

Energy shock 2.0: Why rising Gas prices could hit the Euro

Even without a confirmed, sustained disruption, the mere risk to a key global energy chokepoint is enough to inject a significant premium into European Gas markets. And for the Euro, that matters.

Ripple falters amid sell-off jitters and negative funding rates

Ripple (XRP) has come under pressure, drifting lower to $1.35 at the time of writing on Tuesday. The over 2% correction looks poised to erase the previous day’s gains, which lifted the remittance token to $1.42.