EUR/USD Price Analysis: Languishes near multi-month low, setup favours bearish traders
- EUR/USD consolidates its recent losses to the lowest level since March touched last week.
- The fundamental backdrop favours bearish traders and supports prospects for further losses.
- The recent down leg along a downward-sloping channel also validates the negative outlook.

The EUR/USD pair kicks off the new week on a subdued note and oscillates in a narrow trading band, around mid-1.0600s through the Asian session. Spot prices, meanwhile, remain well within the striking distance of the lowest level since March touched last Friday and seem vulnerable to prolonging the downward trajectory witnessed over the past two months or so.
The US Dollar (USD) stands tall near a more than six-month peak and remains well supported by elevated US Treasury bond yields, bolstered by the Federal Reserve's (Fed) hawkish outlook and the reduction in the expected number of rate cuts in 2024. The shared currency, on the other hand, is undermined by the European Central Bank's (ECB) dovish rate decision last Thursday, which further contributes to keeping a lid on the EUR/USD pair.
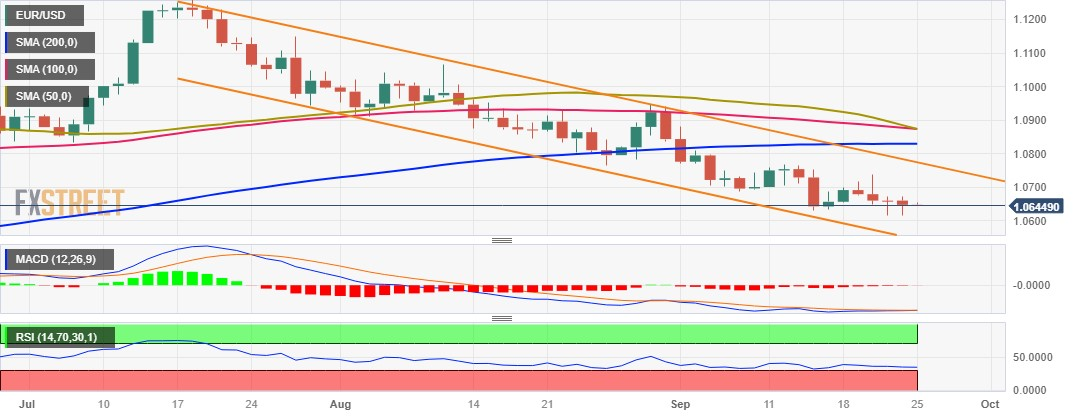
From a technical perspective, the negative outlook is reinforced by the fact that the downfall from the 1.1275 area, or a 17-month peak touched in July, has been along a downward sloping channel. This points to a well-established bearish trend and suggests that the path of least resistance for the EUR/USD pair is to the downside. Moreover, oscillators on the daily chart are holding deep in the negative territory and are still away from being in the oversold zone.
Hence, a subsequent slide towards the 1.0600 round figure, en route to the ascending channel support, currently pegged near the 1.0560-1.0555 region, looks like a distinct possibility. Some follow-through selling will mark a fresh bearish breakdown and set the stage for an extension of the EUR/USD pair's over a two-month-old downtrend.
On the flip side, any recovery beyond the 1.0670 area is likely to confront stiff resistance near the 1.0700 mark. This is followed by last week's swing high, around the 1.0735 region, which if cleared decisively could lift the EUR/USD pair towards challenging the 1.0780 hurdle, representing the top boundary of the aforementioned channel. A convincing breakout, leading to a subsequent move beyond the 1.0800 round figure, will suggest that spot prices have formed a near-term bottom and pave the way for some meaningful near-term appreciating move.
EUR/USD daily chart
Technical levels to watch
Author

Haresh Menghani
FXStreet
Haresh Menghani is a detail-oriented professional with 10+ years of extensive experience in analysing the global financial markets.


