|

EUR/USD Price Analysis: Euro sidelined, trades below 1.0900 figure

  • EUR/USD gets a slow start to the new week. 
  • Immediate resistance can emerge near 1.0900 figure. 
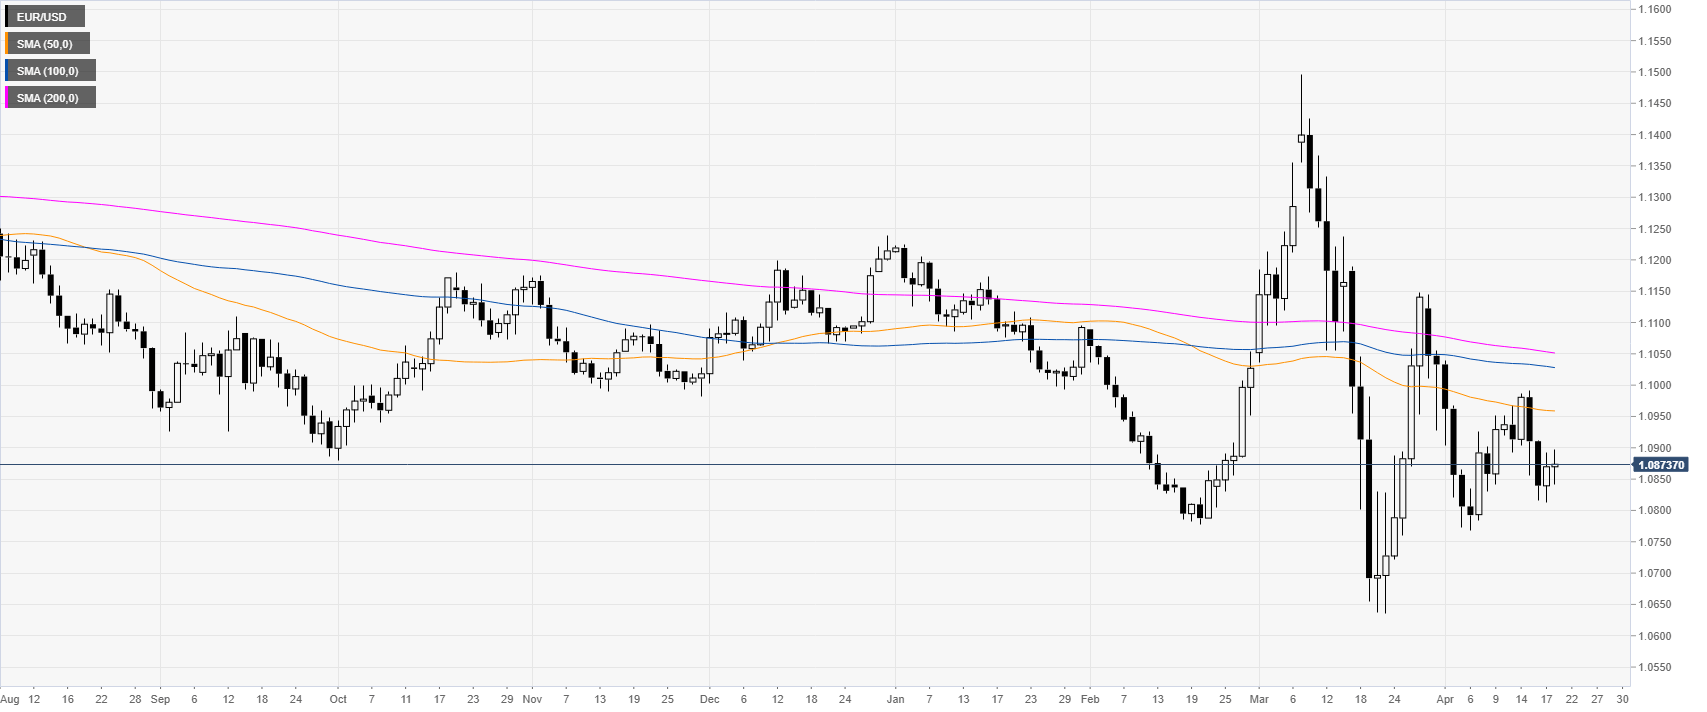
  

EUR/USD daily chart 

 
EUR/USD is trading below the main SMAs on the daily chart as the spot remains confined within familiar ranges at the start of the new week.  
 

EUR/USD four-hour chart

 
The fiber is trading below the 1.0900 figure and the main SMAs on the four-hour chart suggesting a bearish bias in the medium term. However, the quote is rebounding near 1.0845 level as bulls are looking for a daily close above 1.0900 figure which could yield further strength towards the 1.0946 and 1.0991 resistance levels, according to the Technical Confluences Indicator. On the flip side, a daily close below the 1.0800 level could attract further selling interest towards the 1.0743 level. 
 
 
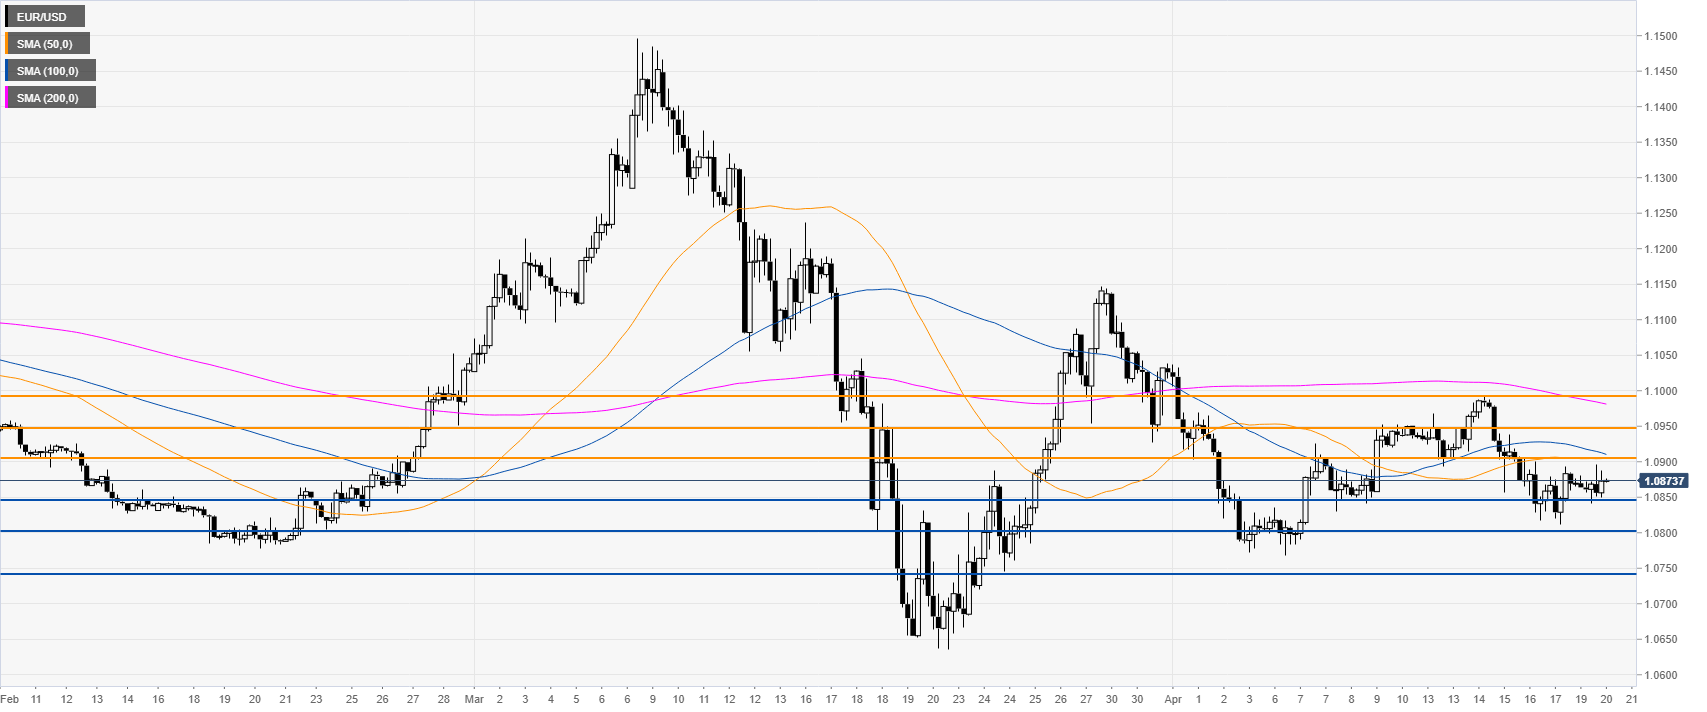
Resistance: 1.0900, 1.0946, 1.0991
Support: 1.0845, 1.0800, 1.0743


Additional key levels

EUR/USD

Overview
Today last price1.0873
Today Daily Change0.0003
Today Daily Change %0.03
Today daily open1.087
 
Trends
Daily SMA201.091
Daily SMA501.0961
Daily SMA1001.1031
Daily SMA2001.1053
 
Levels
Previous Daily High1.0893
Previous Daily Low1.0812
Previous Weekly High1.0991
Previous Weekly Low1.0812
Previous Monthly High1.1497
Previous Monthly Low1.0636
Daily Fibonacci 38.2%1.0862
Daily Fibonacci 61.8%1.0843
Daily Pivot Point S11.0824
Daily Pivot Point S21.0778
Daily Pivot Point S31.0743
Daily Pivot Point R11.0904
Daily Pivot Point R21.0939
Daily Pivot Point R31.0985

Author

Flavio Tosti

Flavio Tosti

Independent Analyst


More from Flavio Tosti
Share:

Editor's Picks

EUR/USD looks to regain the 200-day SMA

EUR/USD regains some balance and trade just above 1.1600 the figure ahead of the opening bell in Asia. The pair initially dipped to the 1.1530 zone for the first time since November, always following the stronger US Dollar and the marked flight-to-safety in the context of the ongoing Middle East crisis
 

GBP/USD attacks 1.3300, refreshing three-month lows

GBP/USD is deep in the red near 1.3300, accelerating its downside to renew three-month lows in European trading on Tuesday. The ongoing escalation in the Iran war, combined with rising Oil prices, weighs negatively on the higher-yielding Pound Sterling as the US Dollar capitalizes on increased haven demand.

Gold bounces off lows, back above $5,100

Gold remains on the defensive, eroding part of the recent multi-day advance and managing to trade back above the $5,100 mark per troy ounce on Tuesday. The precious metal initially dropped just below the critical $5,000 threshold on the back of the persistent strength of the Greenback, higher US Treasury yields across the curve and investors' repricing of Fed rate cuts.

XRP risks extending losses as US-Iran war rages on

Ripple (XRP) has come under pressure, drifting lower to $1.35 at the time of writing on Tuesday. The over 2% correction looks poised to erase the previous day’s gains, which lifted the remittance token to $1.42.

Energy shock 2.0: Why rising Gas prices could hit the Euro

Even without a confirmed, sustained disruption, the mere risk to a key global energy chokepoint is enough to inject a significant premium into European Gas markets. And for the Euro, that matters.

Ripple falters amid sell-off jitters and negative funding rates

Ripple (XRP) has come under pressure, drifting lower to $1.35 at the time of writing on Tuesday. The over 2% correction looks poised to erase the previous day’s gains, which lifted the remittance token to $1.42.