|

EUR/USD Price Analysis: Edges lower to near major support at 1.0950

  • EUR/USD retraces its recent gains as the US Dollar trims its intraday losses.
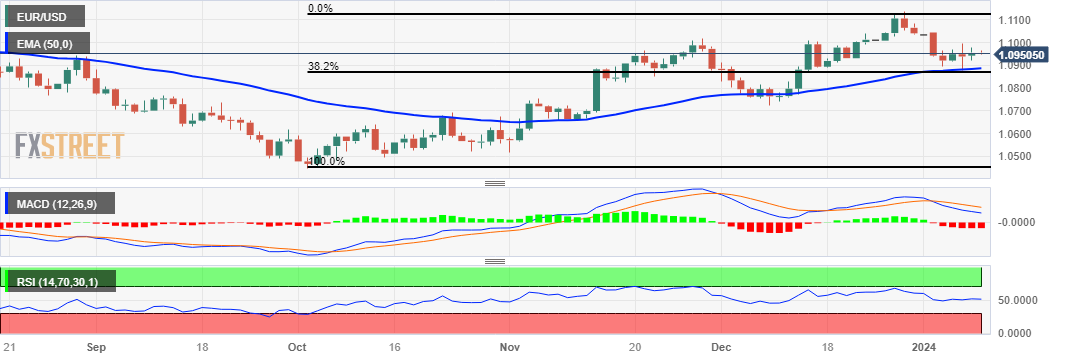
  • A break below 1.0900 could push the pair to navigate the 50-day EMA at 1.0887 followed by the 38.2% Fibonacci retracement level at 1.0867.
  • The psychological level at 1.1000 appears as the key resistance followed by the previous week’s high at 1.1038 level.

EUR/USD retraces its recent gains as the US Dollar (USD) attempts to recover its recent losses. The EUR/USD pair trades lower near 1.0950 major support during the Asian session on Tuesday. A break below could lead the pair to test the psychological level at 1.0900 as the key support region.

A firm collapse below the latter could put downward pressure on the EUR/USD pair to approach the 50-day Exponential Moving Average (EMA) at 1.0887 followed by the 38.2% Fibonacci retracement level at 1.0867 and a major support at 1.0850.

The 14-day Relative Strength Index (RSI) still lies above the 50 mark, indicating an upward momentum in the EUR/USD pair. However, the lagging indicator Moving Average Convergence Divergence (MACD) line is situated above the centerline but diverging below the signal line, suggesting a potential shift toward a downward trend for the EUR/USD pair. Traders will likely wait for the confirmation before making their bets in the pair. 

On the upside, the EUR/USD pair could find the key resistance at the 1.1000 psychological level. A breakthrough above the psychological level could help the EUR/USD pair to reach the previous week’s high at 1.1038 level.

EUR/USD: Daily Chart
EUR/USD: more technical levels to watch

Overview
Today last price1.095
Today Daily Change-0.0005
Today Daily Change %-0.05
Today daily open1.0955
 
Trends
Daily SMA201.0971
Daily SMA501.0871
Daily SMA1001.0763
Daily SMA2001.0847
 
Levels
Previous Daily High1.0979
Previous Daily Low1.0923
Previous Weekly High1.1046
Previous Weekly Low1.0877
Previous Monthly High1.114
Previous Monthly Low1.0724
Daily Fibonacci 38.2%1.0957
Daily Fibonacci 61.8%1.0944
Daily Pivot Point S11.0925
Daily Pivot Point S21.0896
Daily Pivot Point S31.0869
Daily Pivot Point R11.0981
Daily Pivot Point R21.1008
Daily Pivot Point R31.1038

Author

Akhtar Faruqui

Akhtar Faruqui is a Forex Analyst based in New Delhi, India. With a keen eye for market trends and a passion for dissecting complex financial dynamics, he is dedicated to delivering accurate and insightful Forex news and analysis.


More from Akhtar Faruqui
Share:

Editor's Picks

GBP/USD remains below 1.3400 as USD recovers

GBP/USD stalls its rebound and stays below 1.3400 in the European trading hours on Thursday. The pair's upside remains capped by a modest US Dollar bounce and cooler-than-expected UK inflation data amid escalating Middle East tensions.

EUR/USD steadies above 1.1400 ahead of ECB policy decision

EUR/USD holds its upbeat momentum for the second consecutive day, above 1.1400, in the European session on Thursday. The pair stays supported ahead of the European Central Bank's interest rate decision, with any hints on further rate hikes to be closely eyed.

Gold holds losses near $4,100 on surging Oil-led inflation fears

Gold holds the pullback near the $4,100 round figure in Thursday's European session. US crude oil prices climb to a fresh six-week high toward $90 amid a further escalation of tensions between the US and Iran, fueling inflation fears and bolstering US Fed interest rate hike expectations. Hawkish Fed bets weigh negatively on the yieldless bullion.

Hyperliquid, Robinhood could lead crypto’s next bull market as DeFi and TradFi converge

The next crypto bull market could be driven by the growing convergence between blockchain-based financial infrastructure and traditional finance, according to Bitwise CIO Matt Hougan. In a report published late Tuesday, Hougan argued that crypto may be showing early signs of a market bottom, with Bitcoin gaining 9% since July 1 even as the NASDAQ 100 declined 6%.

Bitcoin falls as surging Oil prices revive inflation concerns

Bitcoin extends its correction, trading below $65,800 after a modest decline in the previous day. Despite BTC’s fading strength, US-listed spot Bitcoin Exchange Traded Funds continued to attract institutional inflows on Wednesday, marking the seventh consecutive day of gains.

US Dollar mid-year outlook: Exceptional currency, exceptional risks?
The US Dollar enters the second half of 2026 in a markedly different position from a year ago. The King currency has recovered, reflecting persistent US inflation, changing expectations for Fed policy, geopolitical tensions and renewed demand for defensive assets.