|

EUR/USD Price Analysis: Bulls need to clear the 55-day SMA

  • EUR/USD regains some buying interest beyond 1.0600.
  • There is an initial up-barrier at the 55-day SMA near 1.0715.

EUR/USD pick up pace and reverses, albeit partially, Thursday’s decline at the end of the week.

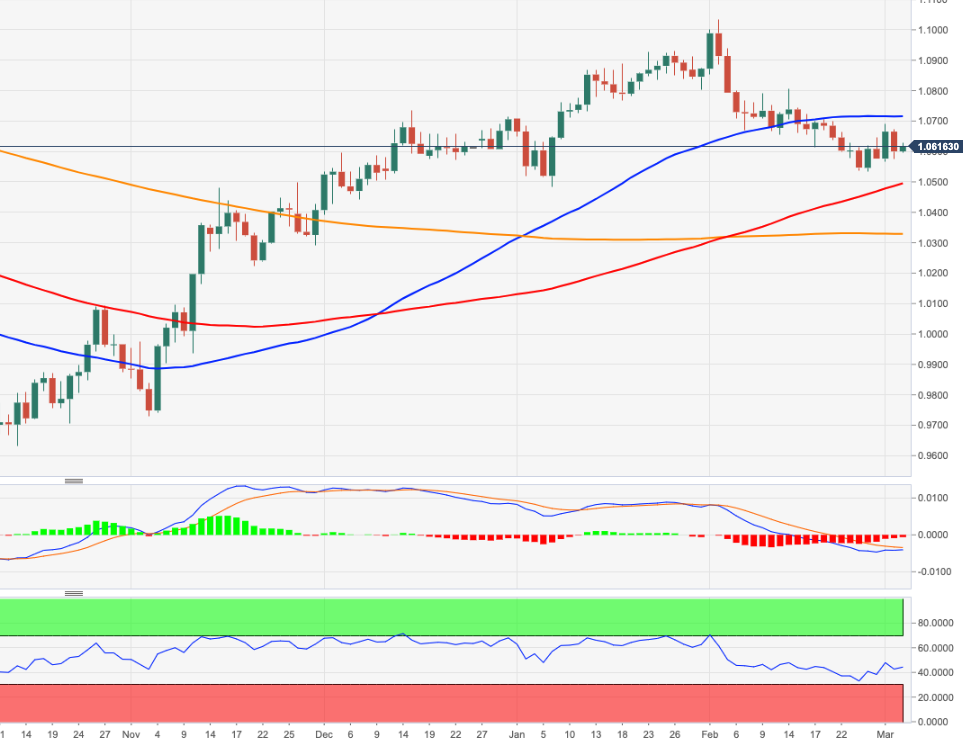
Occasional bullish attempts need to clear the provisional hurdle at the 55-day SMA, today at 1.0714, to allow for extra gains to, initially, the weekly top at 1.0804 (February 14).

Looking at the longer run, the constructive view remains unchanged while above the 200-day SMA, today at 1.0326.

EUR/USD daily chart

EUR/USD

Overview
Today last price1.0616
Today Daily Change35
Today Daily Change %0.15
Today daily open1.06
 
Trends
Daily SMA201.0671
Daily SMA501.0726
Daily SMA1001.0487
Daily SMA2001.0329
 
Levels
Previous Daily High1.0673
Previous Daily Low1.0577
Previous Weekly High1.0705
Previous Weekly Low1.0536
Previous Monthly High1.1033
Previous Monthly Low1.0533
Daily Fibonacci 38.2%1.0613
Daily Fibonacci 61.8%1.0636
Daily Pivot Point S11.056
Daily Pivot Point S21.052
Daily Pivot Point S31.0464
Daily Pivot Point R11.0657
Daily Pivot Point R21.0713
Daily Pivot Point R31.0753

Author

Pablo Piovano

Born and bred in Argentina, Pablo has been carrying on with his passion for FX markets and trading since his first college years.

More from Pablo Piovano
Share:

Markets move fast. We move first.

Orange Juice Newsletter brings you expert driven insights - not headlines. Every day on your inbox.

By subscribing you agree to our Terms and conditions.

Editor's Picks

EUR/USD remains below 1.1700 amid weakening momentum

EUR/USD remains steady after four days of losses, trading around 1.1680 during the Asian hours on Thursday. On the daily chart, the 14-day Relative Strength Index at 42.6 (neutral-bearish) indicates weakening momentum after slipping below the 50 midline. RSI staying sub-50 would keep bears engaged and limit recovery attempts.

GBP/USD consolidates above mid-1.3400s; bullish potential seems intact

The GBP/USD pair is seen consolidating its heavy losses registered over the past two days and oscillating in a narrow trading band, just above mid-1.3400s during the Asian session on Thursday. However, the fundamental backdrop warrants some caution for bearish traders and before positioning for an extension of the retracement slide from the 1.3565-1.3570 region, or the highest level since September 18, touched on Tuesday.

Gold: Deeper correction or dip-buying likely?

Gold is nursing losses near $4,450 in Asian trading on Thursday, having suffered about a 1% correction from weekly highs of $4,500 on Wednesday. All eyes remain on the geopolitical developments and the incoming US jobless claims data for fresh trading directives.

Top Crypto Losers: Pump.fun, Story, and Pudgy Penguins test key support levels

Pump.fun, Story, and Pudgy Penguins experience intense selling pressure over the last 24 hours. PUMP and IP failed to cross the 50-day Exponential Moving Average, resulting in a pullback on Wednesday, while PENGU is testing its 50-day EMA.

2026 economic outlook: Clear skies but don’t unfasten your seatbelts yet

Most years fade into the background as soon as a new one starts. Not 2025: a year of epochal shifts, in which the macroeconomy was the dog that did not bark. What to expect in 2026? The shocks of 2025 will not be undone, but neither will they be repeated.

XRP battles selling pressure as profit-taking, ETF inflows shape outlook

Ripple (XRP) is trading downward but holding support at $2.22 at the time of writing on Wednesday, as fear spreads across the cryptocurrency market, reversing gains made from the start of the year.