|

EUR/USD Price Analysis: A deeper pullback stays on the cards

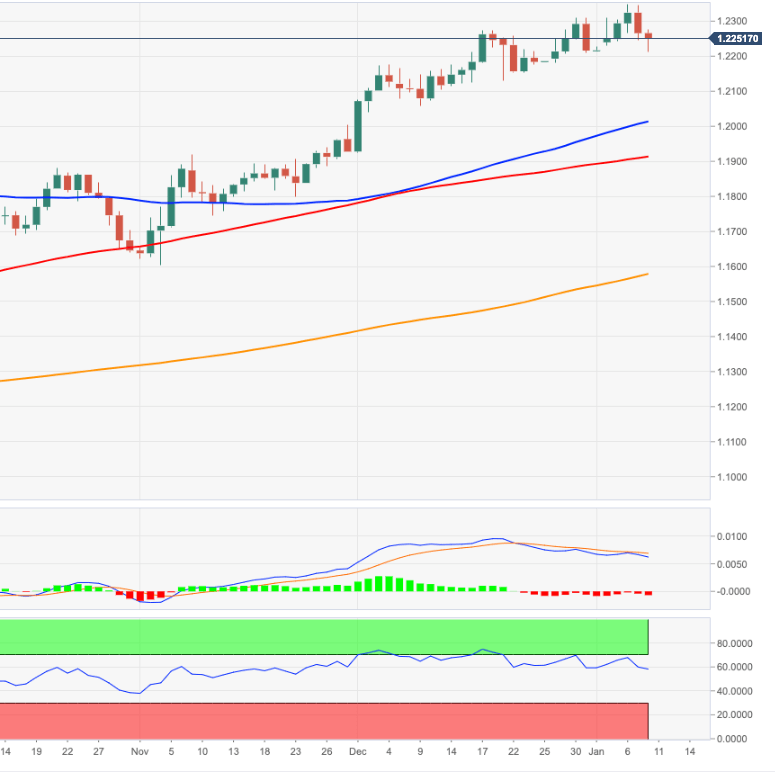
  • EUR/USD tests the 21-day SMA around 1.2210 on Friday.
  • Extra losses could extend to the 1.2130 region.

EUR/USD extends further the downside momentum, testing and rebounding from the 21-day SMA near 1.2210 on Friday.

Against this, the corrective downside in EUR/USD could have further legs to go and a move lower to the weekly low at 1.2129 (December 21) should not be ruled out in the short-term horizon.

In the meantime, extra gains in EUR/USD are likely while above the critical 200-day SMA, today at 1.1564.

Looking at the monthly chart, the (solid) breakout of the 2008-2020 line is a big bullish event and should underpin the continuation of the current trend.

EUR/USD daily chart

EUR/USD

Overview
Today last price1.2248
Today Daily Change59
Today Daily Change %-0.15
Today daily open1.2266
 
Trends
Daily SMA201.222
Daily SMA501.203
Daily SMA1001.1909
Daily SMA2001.1572
 
Levels
Previous Daily High1.2344
Previous Daily Low1.2245
Previous Weekly High1.231
Previous Weekly Low1.2181
Previous Monthly High1.231
Previous Monthly Low1.1924
Daily Fibonacci 38.2%1.2283
Daily Fibonacci 61.8%1.2307
Daily Pivot Point S11.2226
Daily Pivot Point S21.2186
Daily Pivot Point S31.2126
Daily Pivot Point R11.2325
Daily Pivot Point R21.2384
Daily Pivot Point R31.2424

Author

Pablo Piovano

Born and bred in Argentina, Pablo has been carrying on with his passion for FX markets and trading since his first college years.

More from Pablo Piovano
Share:

Editor's Picks

GBP/USD bounces off lows, back above 1.3200

After bottoming out near 1.3160, GBP/USD manages to regain a bit of shine and reclaim the 1.3200 mark and beyond at the end of the week. Stronger-than-expected UK Retail Sales data seem to be helping the British Pound limit its losses, while the chaotic UK political environment keeps the bulls at bay for now.

EUR/USD looks consolidative around 1.1460

EUR/USD stages a modest rebound after slipping to a three-month low below 1.1420 at the end of the week. That said, the pair now looks to consolidate humble gains just above 1.1460 despite growing uncertainty surrounding the next round of US-Iran negotiations, which keeps the US Dollar’s downside contained.

Gold slips back to six-day lows, targets $4,100

Gold retreats for the third consecutive day on Friday, eroding gains seen in the first half of the week and approaching the key $4,100 mark per troy ounce. Indeed, the precious metal continues to face headwinds from the Fed's hawkish stance and renewed uncertainty surrounding the next round of US-Iran negotiations.

Solana extends correction despite ETF inflows, RWA adoption

Solana (SOL) price edges below $70 extending its losses for the fourth straight day this week. The institutional demand for Solana is building, with steady inflows so far this week and Morgan Stanley’s amended S-1 filing for a Solana-focused Exchange-Traded Fund.

The Iran war didn't break the US economy, but what happens next?

Nearly four months after the start of the Iran war, the US economy remains remarkably resilient. While the conflict initially triggered a severe disruption to global energy markets and a sharp rise in Oil prices, recent diplomatic progress between Washington and Tehran has eased concerns about a prolonged supply shock.

Regime change: Inside Kevin Warsh's first move to make the Fed unreadable on purpose

The rate did not move. That was the least interesting thing about Kevin Warsh's first meeting in charge of the Fed. The FOMC held its benchmark at 3.50%-3.75% for the fourth straight meeting, exactly as priced, and then the new chair used his first press conference to dismantle the machinery the market has leaned on for a decade.