|

EUR/USD capped by two resistance clusters and may struggle to recover – Confluence Detector

EUR/USD is trading in the mid 1.11s, off the highs. Where next for the world´s most popular currency pair_

The Technical Confluences Indicator is showing that euro/dollar is capped at 1.1155, which is a dense cluster of lines including the Fibonacci 23.6% one-day, the Fibonacci 38.2% one-month, the SMA 50-15m, the previous 4h-low, the Bollinger Band 15min-Middle, and the BB 1h-Middle. 

Further above, a stronger resistance line awaits at the pair. The 1.1190 level is the convergence of the Fibonacci 23.6% one-month, the Pivot Point one-day Resistance 1, and the SMA 50-4h. 

Looking down, support awaits at 1.1097, which is the confluence of the PP 1d-S2, the Fibonacci 61.8% one-month, and the SMA 50-1d. 

Lower, 1.1068 is another cushion. It is the meeting point of the SMA 100-1d and the PP 1m-S1. 

Here is how it looks on the tool:
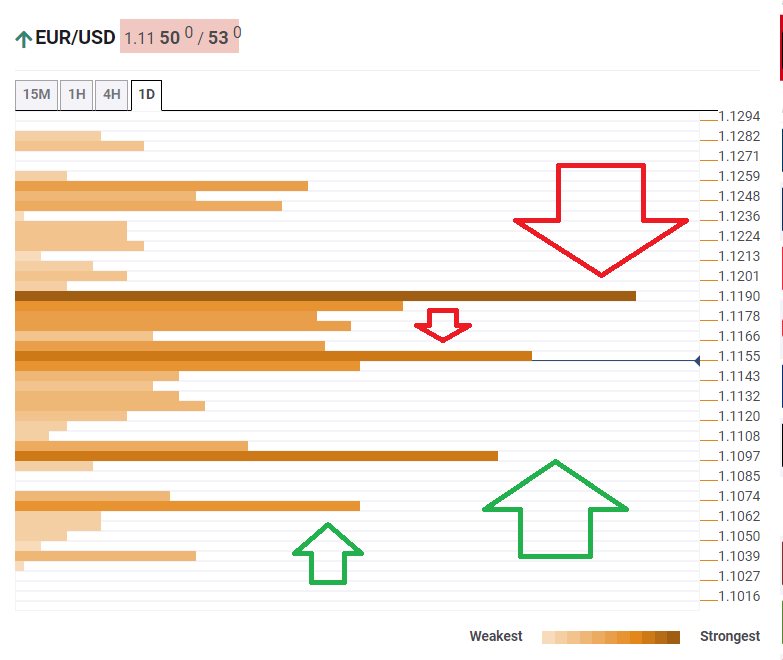
EUR USD technical confluence January 8

Confluence Detector

The Confluence Detector finds exciting opportunities using Technical Confluences. The TC is a tool to locate and point out those price levels where there is a congestion of indicators, moving averages, Fibonacci levels, Pivot Points, etc. Knowing where these congestion points are located is very useful for the trader, and can be used as a basis for different strategies.

This tool assigns a certain amount of “weight” to each indicator, and this “weight” can influence adjacents price levels. These weightings mean that one price level without any indicator or moving average but under the influence of two “strongly weighted” levels accumulate more resistance than their neighbors. In these cases, the tool signals resistance in apparently empty areas.

Learn more about Technical Confluence

Author

Yohay Elam

Yohay Elam

FXStreet

Yohay is in Forex since 2008 when he founded Forex Crunch, a blog crafted in his free time that turned into a fully-fledged currency website later sold to Finixio.


More from Yohay Elam
Share:

Editor's Picks

GBP/USD weakens to two-week lows near 1.3520

GBP/USD trades on the back foot, returning to the low 1.3500s, or two-week troughs, on Tuesday. Cable’s bearish price action follows decent gains in the Greenback at the time when investors assess latest US data releases and the persistent uncertainty in the US-Iran crisis.

EUR/USD remains offered; breaks below 1.1600

EUR/USD now accelerates its daily correction, breaching below the key 1.1600 support level on Tuesday. The pair’s daily correction comes on the back of a decent bounce in the US Dollar despite disappointing US data releases and amid persistent geopolitical concerns.

Gold flirts with multi-week lows near $4,300

Gold accelerates its correction and recedes toward the key $4,300 mark per troy ounce on Tuesday. The yellow metal’s persistent decline comes in response to the solid performance of the US Dollar and a sharp move higher in US Treasury yields across the curve.

RBNZ set to raise interest rate to 2.75%
The Reserve Bank of New Zealand (RBNZ) is on track to deliver a follow-through interest rate hike, raising the Official Cash Rate (OCR) by another 25 basis points (bps) from 2.50% to 2.75% on Wednesday. Experts expect a consensus decision this week, unlike a deeply divided outcome predicted during the July monetary policy meeting.
Global bond market sell off haunts markets

Global sovereign bonds are selling off as we start a new month. The UK is, unsurprisingly, taking the biggest hit. Two and 10-year yields rose by 10 basis points at one point on Tuesday, and are currently higher by 7 and 8bps respectively.

Diesel’s record $100 warning: The oil shock hiding in plain sight

The Oil market may look calmer than it did a few months ago, but diesel is sending a very different message. The US diesel crack spread, the premium of ultra-low sulphur diesel futures over WTI, recently surged above $100 per barrel for the first time, reaching an intraday record of just over $102.00.