|

EUR/USD Asia Price Forecast: Euro records largest daily decline since June 2018

  • EUR/USD is consolidating above the 1.0970 support level on broad-based USD strength.
  • EUR/USD is trading at two-week’s lows while registering its largest daily drop since June 2018.
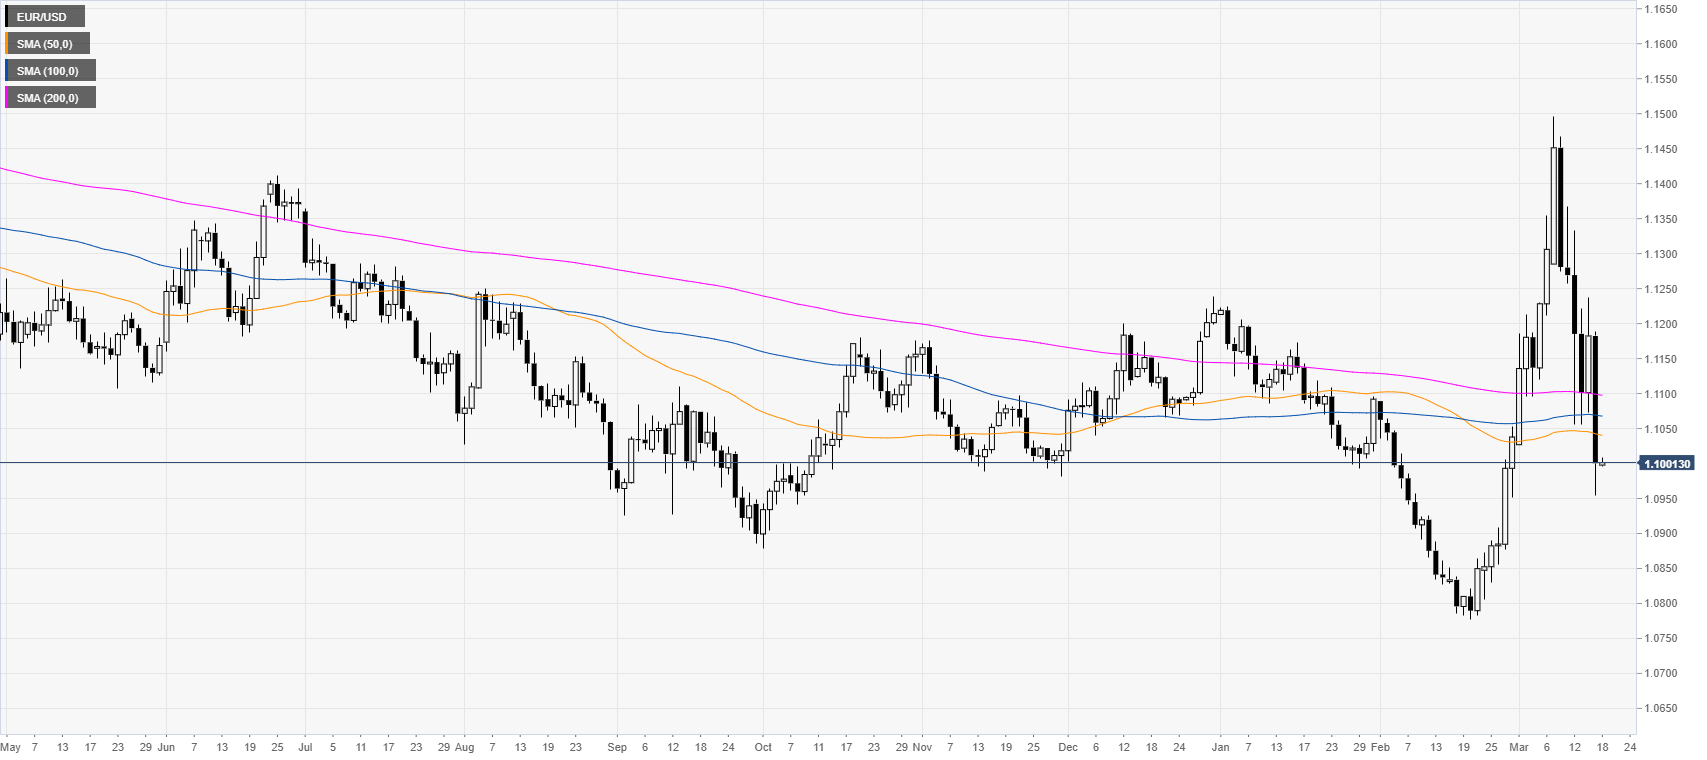
 

EUR/USD daily chart 

 
The euro is trading at its lowest in two weeks while below its main SMAs. DXY (US dollar index) rose to the upside while pushing EUR/USD down recording its largest daily decline since June 2018. 
  

EUR/USD four-hour chart

 
EUR/USD is consolidating Tuesday’s drop near the 1.1000 figure while just below the 200 SMA on the four-hour chart. As the sellers remain in control a break below the 1.0970 support can extend losses towards the 1.0885 and 1.0850 price levels. Resistance is seen near the 1.1016, 1.1073 and 1.1100 levels, according to the Technical Confluences Indicator.    
  
 
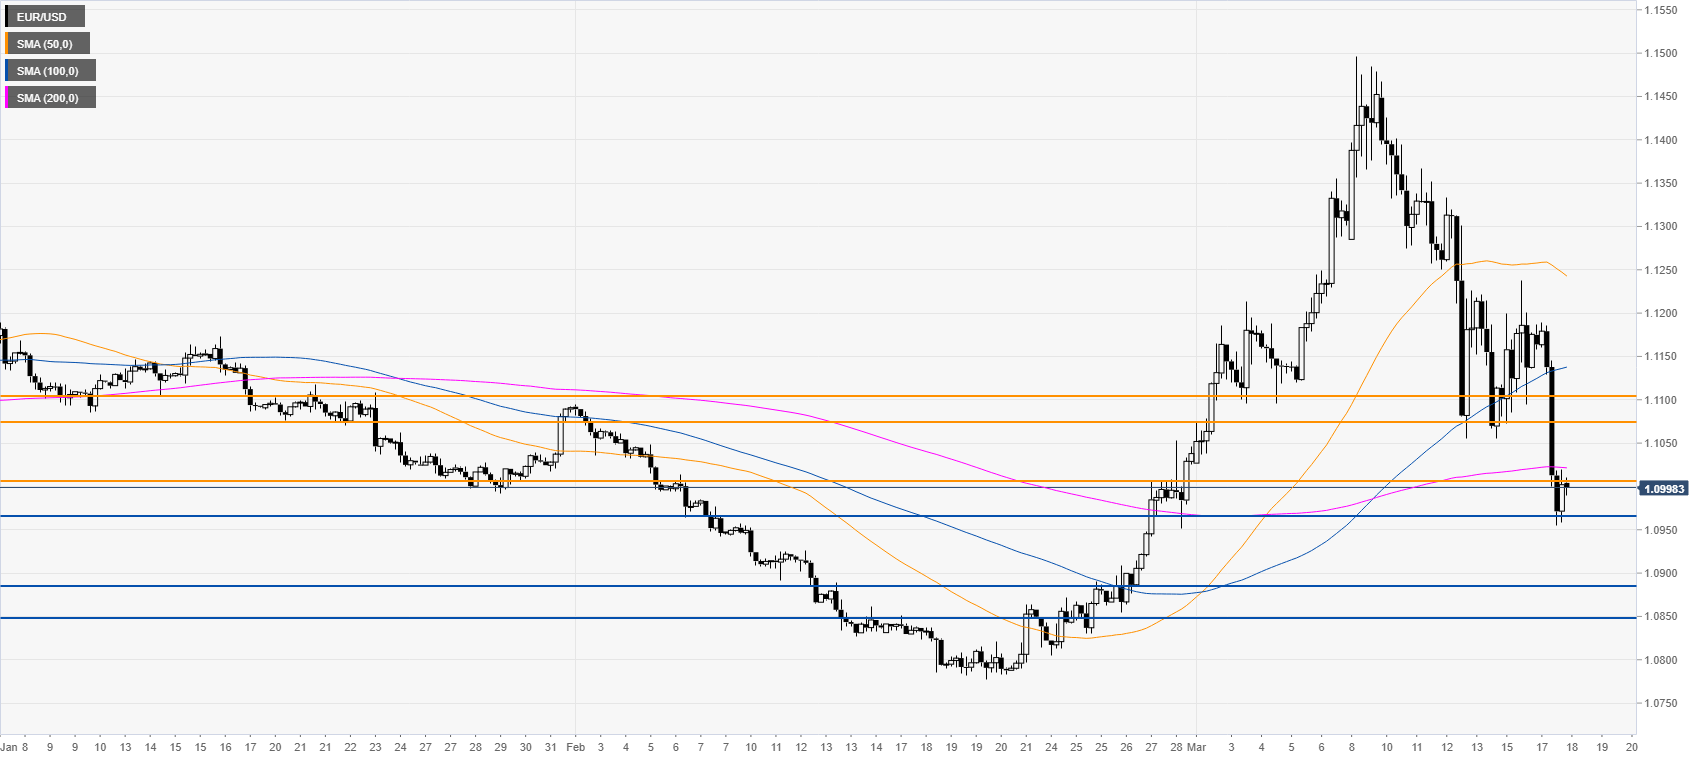
Resistance: 1.1016, 1.1073, 1.1100
Support: 1.0970, 1.0885, 1.0850


Additional key levels

XAU/USD

Overview
Today last price1528.88
Today Daily Change15.89
Today Daily Change %1.05
Today daily open1512.99
 
Trends
Daily SMA201620.62
Daily SMA501587.99
Daily SMA1001535.53
Daily SMA2001499.98
 
Levels
Previous Daily High1575.63
Previous Daily Low1451.32
Previous Weekly High1703.4
Previous Weekly Low1504.72
Previous Monthly High1689.4
Previous Monthly Low1547.56
Daily Fibonacci 38.2%1498.81
Daily Fibonacci 61.8%1528.14
Daily Pivot Point S11451
Daily Pivot Point S21389
Daily Pivot Point S31326.69
Daily Pivot Point R11575.31
Daily Pivot Point R21637.62
Daily Pivot Point R31699.62

Author

Flavio Tosti

Flavio Tosti

Independent Analyst


More from Flavio Tosti
Share:

Editor's Picks

EUR/USD extends losses toward 1.1600 ahead of EU inflation data

EUR/USD extends the decline toward 1.1600 in the European session on Tuesday. The pair remains under pressure as surging energy prices amid the US-Iran war have increased the risks of higher inflation for the Old Continent. The focus is now on the Eurozone preliminary inflation reading for February. 

GBP/USD attacks 1.3300, refreshing three-month lows

GBP/USD is deep in the red near 1.3300, accelerating its downside to renew three-month lows in European trading on Tuesday. The ongoing escalation in the Iran war, combined with rising Oil prices, weighs negatively on the higher-yielding Pound Sterling as the US Dollar capitalizes on increased haven demand.

Gold falls below $5,300 as stronger USD counter Middle East woes

Gold attracts some intraday selling and falls below $5,300 on Tuesday. The US Dollar climbs to a fresh high since January 20 and turns out to be a key factor exerting downward pressure on the commodity. However, concerns about a broader regional conflict in the Middle East continue to weigh on investors' sentiment and underpin demand for the traditional safe-haven bullion.

Stellar risks deeper losses as derivatives metrics turn negative

Stellar is trading red below $0.16 at the time of writing on Tuesday, after a slight recovery the previous day. Weakening derivatives data caps the recovery, while an unfavorable technical outlook projects a deeper correction for the XLM token in the upcoming days.

The market is not panicking it is repricing the probability distribution of Oil and time

At the end of the day, markets do not trade morality or geopolitics. They trade transmission channels. And the only channel that truly matters in this maelstrom runs through the price of energy and the time value of money.

Hyperliquid Price Forecast: HYPE rises on commodities demand amid US-Iran war

Hyperliquid (HYPE) steadies above $33 at press time on Tuesday, marking its fourth consecutive day of recovery in a broadly volatile market due to the ongoing US-Israel strikes on Iran.