|

EUR/JPY Price Analysis: The key hurdle is seen at the 163.00-163.10 zone

  • EUR/JPY remains capped below 163.00 ahead of the Eurozone PMI data.
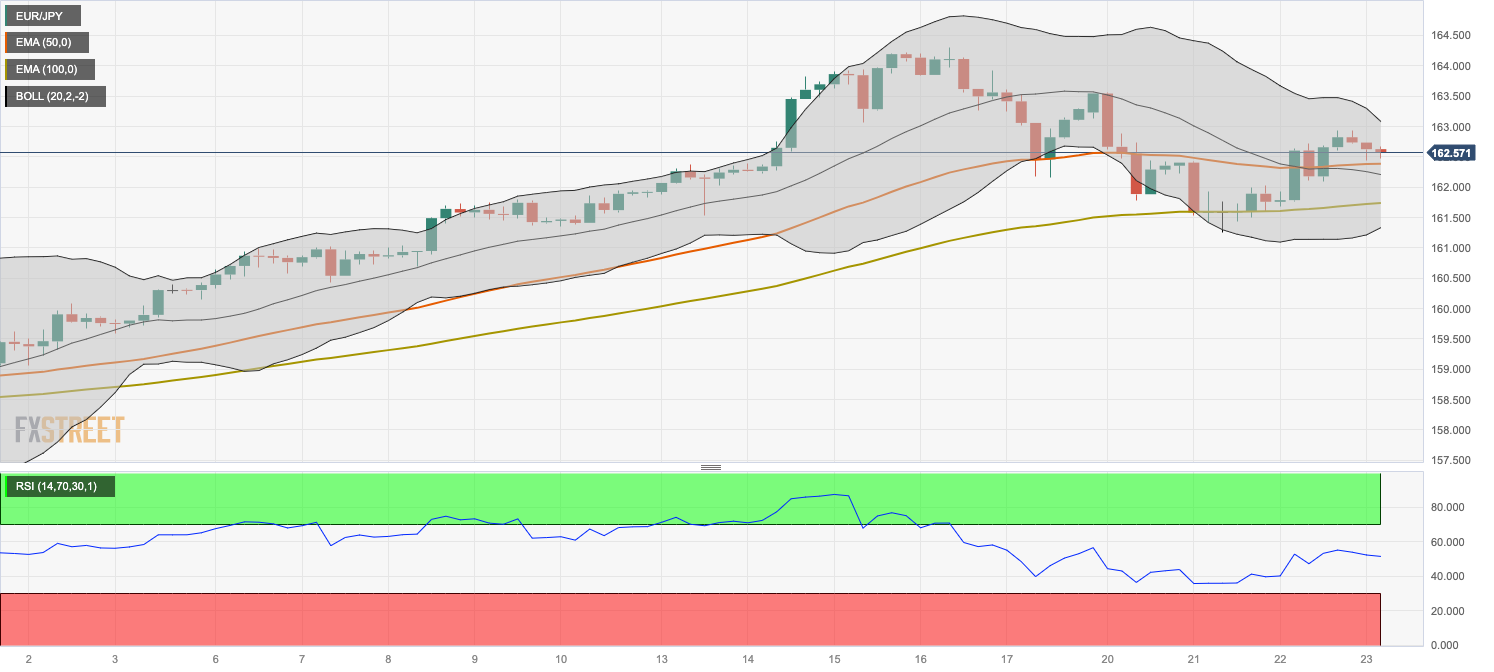
  • The cross maintains a positive outlook above the 100-hour EMA; RSI indicator is located in the bullish territory above 50.
  • The key resistance level is located at the 163.00–163.10 zone; 162.10 acts as an initial support level for EUR/JPY.

The EUR/JPY cross loses momentum after facing a rejection from 163.00 during the early European session on Thursday. As of writing, the cross is trading near 162.60, down 0.20% on the day. Investors await the preliminary Eurozone PMI data for fresh impetus. The downbeat reading could fuel the fear of a recession in the Eurozone and exert some selling pressure on the Euro (EUR) against the Japanese Yen (JPY).

Technically, EUR/JPY maintains a positive outlook on the four-hour chart as the cross holds above the key 100-hour Exponential Moving Averages (EMAs). Furthermore, the Relative Strength Index (RSI) is located in the bullish territory above 50, indicating that further upside looks favorable.

That being said, the key resistance level is located in the 163.00–163.10 area. The mentioned level is the confluence of the upper boundary of the Bollinger Band and a psychological round figure. The next upside barrier is seen at a high of November 19 at 163.55. A break above the latter will see the rally to the year-to-date (YTD) high of 164.30.

On the other hand, a low of November 22 at 162.10 acts as an initial support level for EUR/JPY. The additional downside filter to watch is the 100-hour EMA at 161.74. A breach of the latter will see a drop to the lower limit of the Bollinger Band at 161.33, followed by a low of November 7 at 160.43, and finally the round figure at 160.00.

EUR/JPY four-hour chart

EUR/JPY

Overview
Today last price162.58
Today Daily Change-0.32
Today Daily Change %-0.20
Today daily open162.9
 
Trends
Daily SMA20161.28
Daily SMA50159.17
Daily SMA100158.18
Daily SMA200153.02
 
Levels
Previous Daily High162.94
Previous Daily Low161.6
Previous Weekly High164.31
Previous Weekly Low161.54
Previous Monthly High160.85
Previous Monthly Low154.39
Daily Fibonacci 38.2%162.43
Daily Fibonacci 61.8%162.11
Daily Pivot Point S1162.01
Daily Pivot Point S2161.13
Daily Pivot Point S3160.67
Daily Pivot Point R1163.36
Daily Pivot Point R2163.82
Daily Pivot Point R3164.71

Author

Lallalit Srijandorn

Lallalit Srijandorn is a Parisian at heart. She has lived in France since 2019 and now becomes a digital entrepreneur based in Paris and Bangkok.

More from Lallalit Srijandorn
Share:

Markets move fast. We move first.

Orange Juice Newsletter brings you expert driven insights - not headlines. Every day on your inbox.

By subscribing you agree to our Terms and conditions.

Editor's Picks

EUR/USD edges above 1.1750 due to ECB-Fed policy divergence

EUR/USD has recovered its recent losses registered in the previous session, trading around 1.1760 during the Asian hours on Friday. Traders will likely observe Germany’s Manufacturing Purchasing Managers’ Index data later in the day.

GBP/USD gathers strength above 1.3450 on Fed rate cut bets, BoE's gradual policy path

The GBP/USD pair gathers strength to around 1.3480 during the early Asian session on Friday. Expectations of the US Federal Reserve rate cuts this year weigh on the US Dollar against the Pound Sterling. Philadelphia Fed President Anna Paulson is set to speak later on the weekend. 

Gold climbs to near $4,350 on Fed rate cut bets, geopolitical risks

Gold price rises to near $4,345 during the early Asian session on Friday. Gold finished 2025 with a significant rally, achieving an annual gain of around 65%, its biggest annual gain since 1979. The rally of the precious metal is bolstered by the prospect of further US interest rate cuts in 2026 and safe-haven flows.

Bitcoin, Ethereum and Ripple enter the New Year with breakout hopes

Bitcoin, Ethereum, and Ripple entered the new year trading at key technical levels on Friday, as traders seek fresh directional cues in January. With BTC locked in a tight range, ETH is approaching its 50-day Exponential Moving Average, while XRP is nearing resistance. A clear breakout across these top three cryptocurrencies could help define market momentum in the opening weeks of the year.

Economic outlook 2026-2027 in advanced countries: Solidity test

After a year marked by global economic resilience and ending on a note of optimism, 2026 looks promising and could be a year of solid economic performance. In our baseline scenario, we expect most of the supportive factors at work in 2025 to continue to play a role in 2026.

Crypto market outlook for 2026

Year 2025 was volatile, as crypto often is.  Among positive catalysts were favourable regulatory changes in the U.S., rise of Digital Asset Treasuries (DAT), adoption of AI and tokenization of Real-World-Assets (RWA).