|

EUR/JPY Price Analysis: Mildly offered inside three-week-old falling channel

  • EUR/JPY fades bounce off 13-month low, sidelined of late.
  • Sluggish Momentum, bearish chart pattern keep sellers hopeful.
  • 50-SMA, 200-SMA adds to the upside filters, 2020’s peak also challenge bears.

EUR/JPY reverses the corrective pullback from February 2021 lows, marked the previous day, inside a short-term descending trend channel formation. That said, the quote remains pressured around 128.30 by the press time of Thursday’s Asian session.

As the Momentum indicator portrays sluggish moves in favor of the previous rebound with the below zero figures, the EUR/JPY is likely to remain downbeat.

That said, the quote’s latest weakness eyes Wednesday’s low, also the lowest in 13 months, around 127.30.

However, tops marked during the year 2020 and the stated channel’s support line appears a tough nut to crack for the EUR/JPY bears around 127.00.

Alternatively, recovery moves may aim for the 129.00 threshold but the 50-SMA and upper line of the stated channel, near 129.30-45, will question EUR/JPY bulls afterward.

Also likely to challenge the pair’s upside is the 200-SMA level of 130.00, a break of which will propel an upside momentum targeting February’s peak of 133.15.

EUR/JPY: Four-hour chart
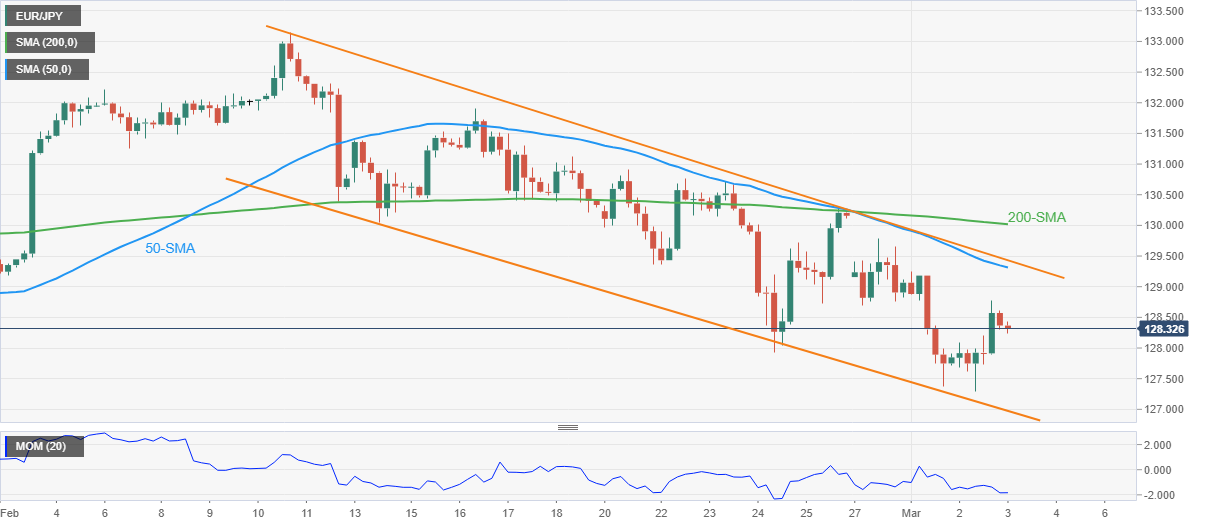
Trend: Bearish

Additional important levels

Overview
Today last price128.34
Today Daily Change-0.21
Today Daily Change %-0.16%
Today daily open128.55
 
Trends
Daily SMA20130.58
Daily SMA50130.21
Daily SMA100130.14
Daily SMA200130.32
 
Levels
Previous Daily High128.78
Previous Daily Low127.3
Previous Weekly High130.91
Previous Weekly Low127.92
Previous Monthly High133.15
Previous Monthly Low127.92
Daily Fibonacci 38.2%128.21
Daily Fibonacci 61.8%127.86
Daily Pivot Point S1127.64
Daily Pivot Point S2126.73
Daily Pivot Point S3126.16
Daily Pivot Point R1129.12
Daily Pivot Point R2129.69
Daily Pivot Point R3130.59

Author

Anil Panchal

Anil Panchal

FXStreet

Anil Panchal has nearly 15 years of experience in tracking financial markets. With a keen interest in macroeconomics, Anil aptly tracks global news/updates and stays well-informed about the global financial moves and their implications.

More from Anil Panchal
Share:

Editor's Picks

AUD/USD falls to near 0.7100 after slipping below 50-day EMA

AUD/USD depreciates after registering minor gains in the previous day, trading around 0.7120 during the Asian hours. The technical analysis of the daily chart shows the pair consolidating sideways within a rectangle pattern, as neither bulls nor bears gain control. The AUD/USD pair is holding a slight bearish tone however as it sits beneath both the nine-day and 50-day EMAs.

160.00: USD/JPY back near intervention territory after upbeat US jobs report

US Nonfarm Payrolls beat expectations by a wide margin in May, with 172K jobs added. The US Dollar rebounds after the release, helping USD/JPY recover from its intraday lows. Warnings from Japanese authorities continue to limit upside potential near the 160.00 threshold.

Gold weakens to three-month lows near $4,300

Gold faces increasing selling interest and approaches the area of three-month lows near the $4,300 mark per troy ounce on Friday. The precious metal’s decline comes as traders assess the stronger-than-expected NFP, while the bid bias in the Greenback and higher US Treasury yields also collaborate with the retracement.

Cardano hits five-year low even as Hoskinson clarifies "break" isn't an exit

Cardano (ADA) price is down 10% at press time on Friday, extending losses over 30% so far this week amid Charles Hoskinson's clarification that "break" isn't an exit.

Week ahead – Fed countdown begins amid US inflation data and geopolitical risks

Fed Chair Warsh’s first meeting approaches as key US inflation data could reshape expectations. Oil prices remain elevated as US-Iran talks continue; tariffs also return to the spotlight. ECB is expected to hike; will it be a one-off move or is July live?

The US economy defies the rules: 100 days into the Oil shock and the recession signal is still missing

More than three months after the start of the Iran war and the resulting disruption to global energy markets, the US economy continues to display remarkable resilience. The conflict has triggered a sharp rise in Oil prices, reignited inflationary pressures and fueled widespread concerns about a potential economic slowdown.