• On Monday, the EUR/JPY registered minimal gains of 0.14%.
  • EUR/JPY daily chart depicts the pair as neutral-to-downward biased; however, a break above 137.92 could shift the bias.
  • Short term, the EUR/JPY is neutral-to-upwards, but breaks below 137.06, shift the bias to neutral.

The EUR/JPY seesaws as the Asian Pacific session begins, just below the confluence of the 20 and 100-day EMA, around 137.99-138.19 area, amidst fragile sentiment, as shown by Asian equity futures set to open lower, while US equities closed mixed. At the time of writing, the EUR/JPY is trading at 137.62, slightly up 0.02%.

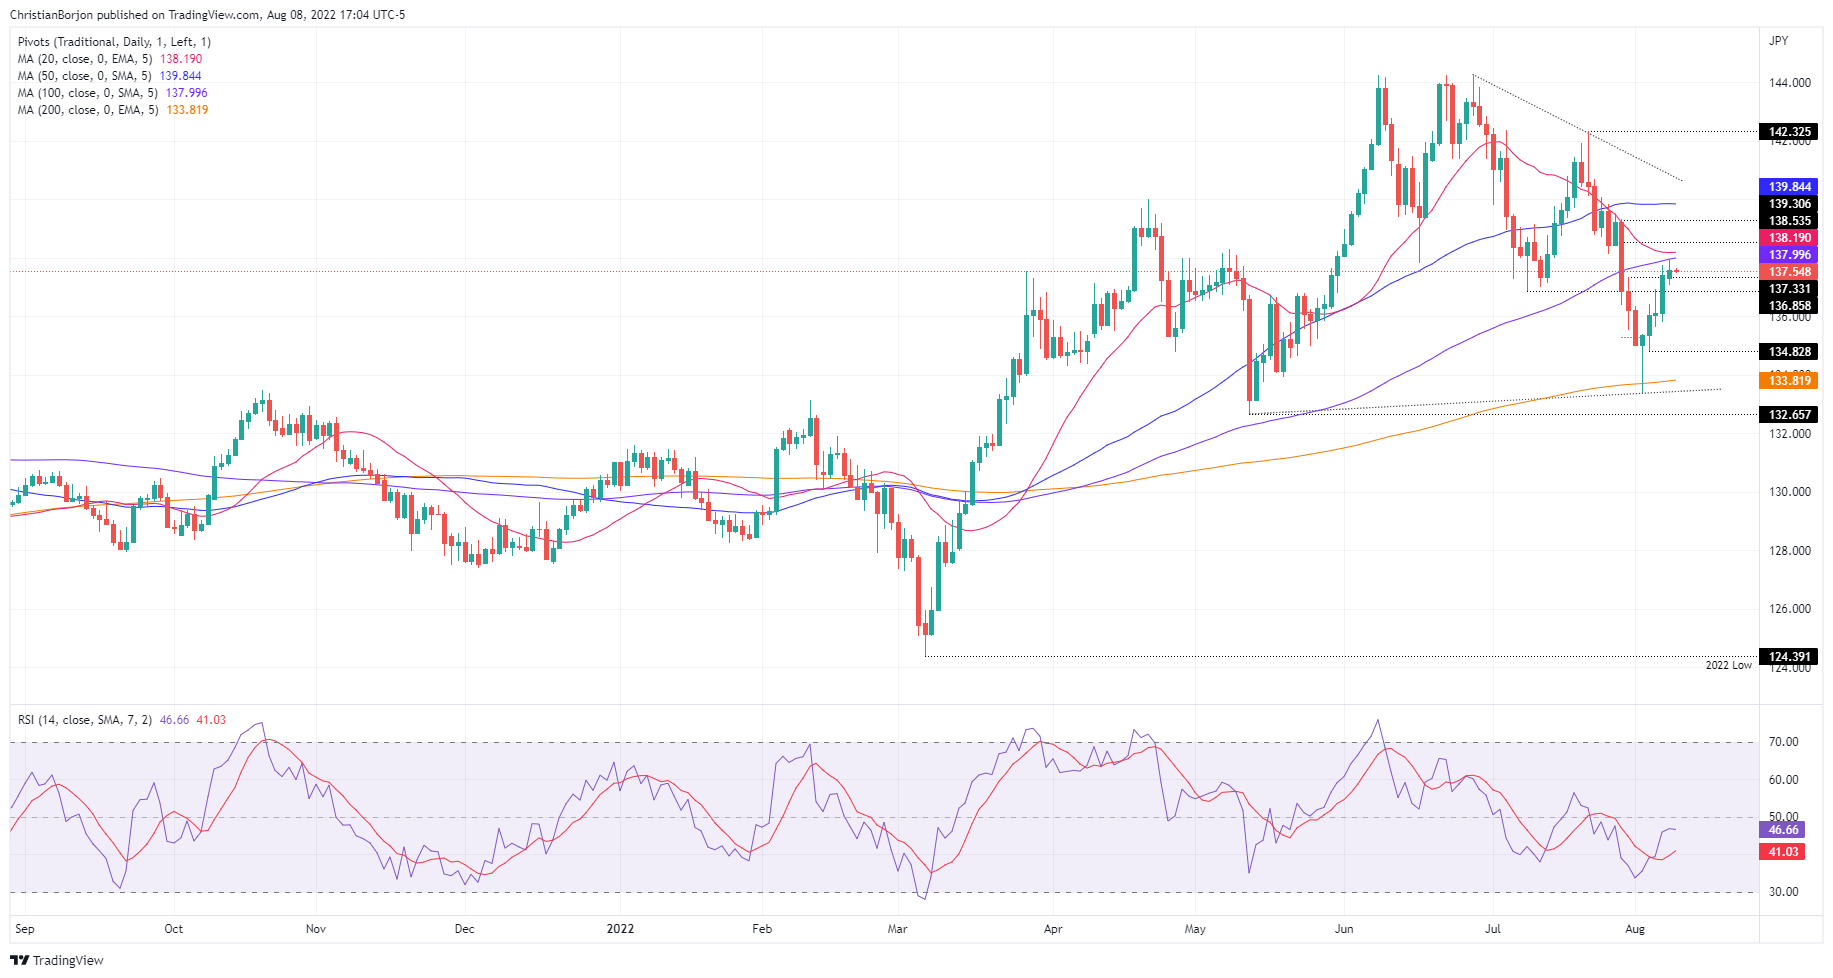
EUR/JPY Price Analysis: Technical outlook

From a daily chart perspective, the EUR/JPY is bearish biased. Successions of lower highs/lows, alongside daily EMAs above the exchange rate, confirm those above. Also, sellers are gathering momentum, per the Relative Strength Index (RSI) shows, at 46.05, with an almost horizontal slope, but still in negative territory. Therefore, the EUR/JPY's first support would be the August 8 daily low at 137.06. A break below could pave the way towards 135.80 August 5 low, exacerbating further downside action. On the flip side, the EUR/JPY's first resistance would be the August 8 high at 137.92.

EUR/JPY Daily chart

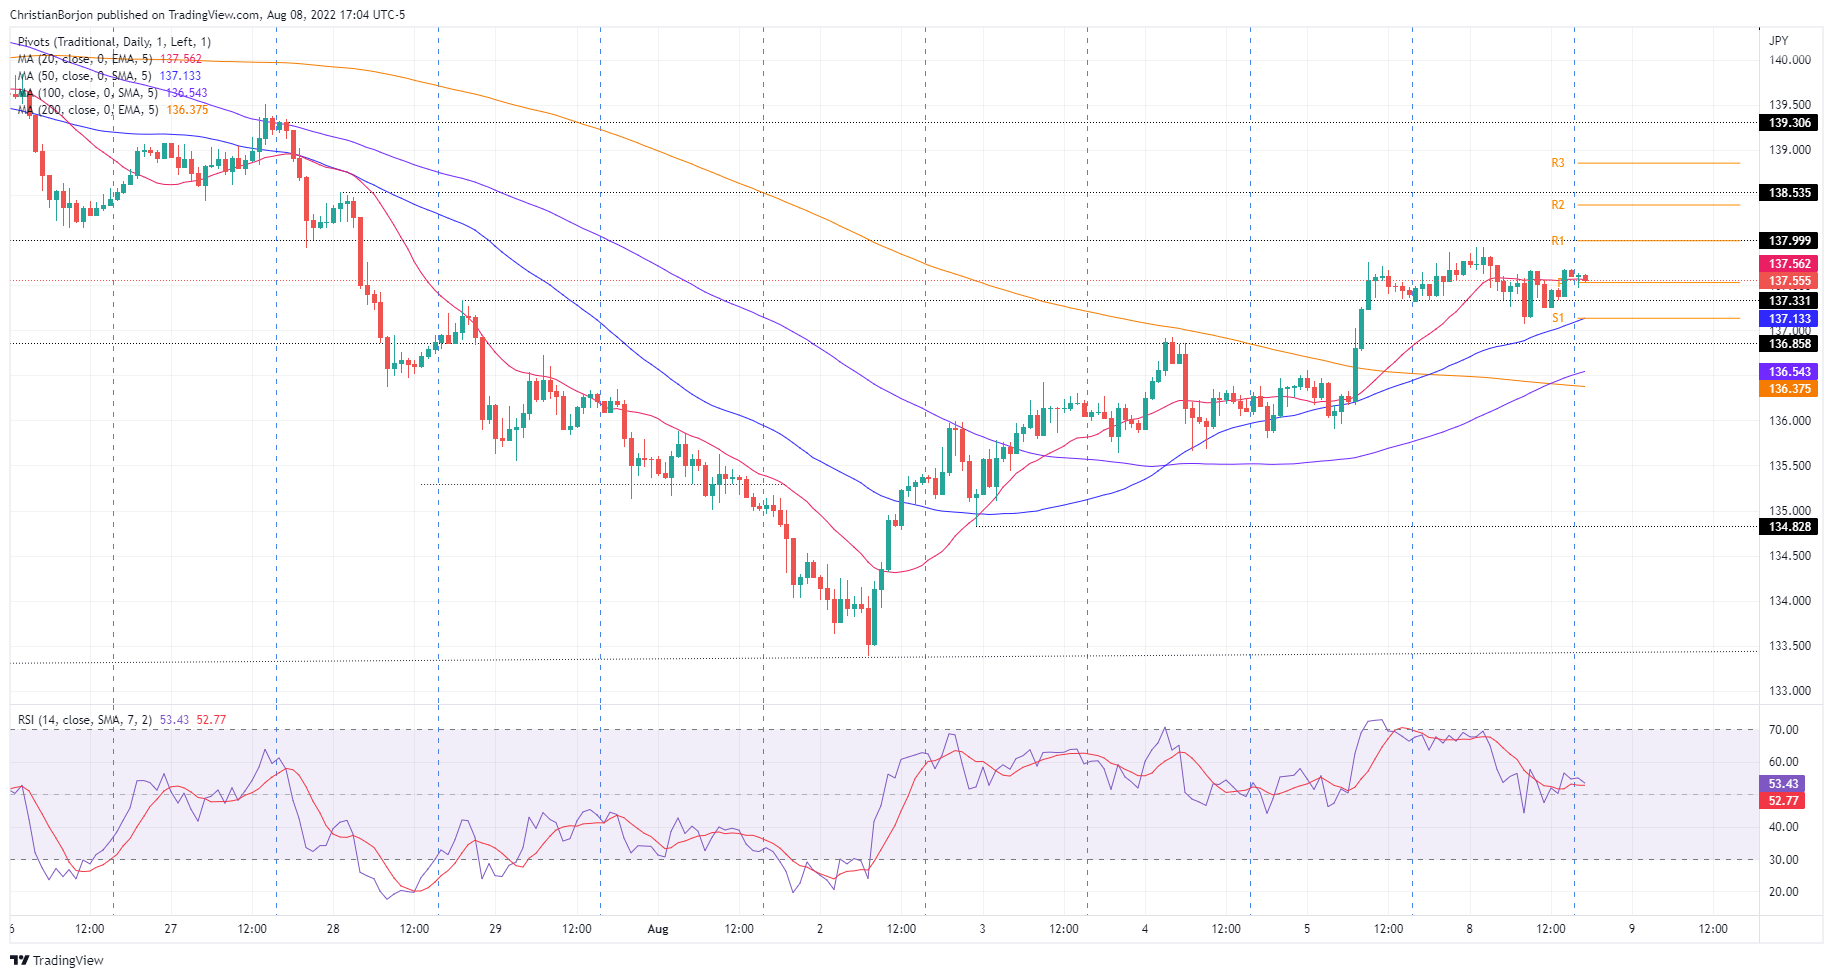
Meanwhile, the EUR/JPY  hourly chart portrays an opposite bias to the daily chart, neutral-to-upwards. Factors like the hourly EMAs, below the exchange rate, alongside the Relative Strength Index (RSI) at bullish territory, back up the bias.

Therefore, the EUR/JPY's first resistance would be the confluence of the August 8 high and the R1 pivot around 137.92-138.00. A breach of the latter will expose the R2 daily pivot at 138.40, followed by the R3 pivot point at 138.87. On the other hand, a EUR/JPY break below 137.06 might shift the bias to neutral, opening the door for further losses.

EUR/JPY Hourly chart

EUR/JPY Key Technical Levels

EUR/JPY

Overview
Today last price 137.62
Today Daily Change 0.12
Today Daily Change % 0.09
Today daily open 137.5
 
Trends
Daily SMA20 138.23
Daily SMA50 139.89
Daily SMA100 137.93
Daily SMA200 133.8
 
Levels
Previous Daily High 137.76
Previous Daily Low 135.8
Previous Weekly High 137.76
Previous Weekly Low 133.4
Previous Monthly High 142.43
Previous Monthly Low 135.55
Daily Fibonacci 38.2% 137.01
Daily Fibonacci 61.8% 136.55
Daily Pivot Point S1 136.28
Daily Pivot Point S2 135.06
Daily Pivot Point S3 134.32
Daily Pivot Point R1 138.24
Daily Pivot Point R2 138.98
Daily Pivot Point R3 140.2


Share: Feed news

Information on these pages contains forward-looking statements that involve risks and uncertainties. Markets and instruments profiled on this page are for informational purposes only and should not in any way come across as a recommendation to buy or sell in these assets. You should do your own thorough research before making any investment decisions. FXStreet does not in any way guarantee that this information is free from mistakes, errors, or material misstatements. It also does not guarantee that this information is of a timely nature. Investing in Open Markets involves a great deal of risk, including the loss of all or a portion of your investment, as well as emotional distress. All risks, losses and costs associated with investing, including total loss of principal, are your responsibility. The views and opinions expressed in this article are those of the authors and do not necessarily reflect the official policy or position of FXStreet nor its advertisers. The author will not be held responsible for information that is found at the end of links posted on this page.

If not otherwise explicitly mentioned in the body of the article, at the time of writing, the author has no position in any stock mentioned in this article and no business relationship with any company mentioned. The author has not received compensation for writing this article, other than from FXStreet.

FXStreet and the author do not provide personalized recommendations. The author makes no representations as to the accuracy, completeness, or suitability of this information. FXStreet and the author will not be liable for any errors, omissions or any losses, injuries or damages arising from this information and its display or use. Errors and omissions excepted.

The author and FXStreet are not registered investment advisors and nothing in this article is intended to be investment advice.

Recommended content


Recommended content

Editors’ Picks

EUR/USD holds gains near 1.0650 amid risk reset

EUR/USD holds gains near 1.0650 amid risk reset

EUR/USD is holding onto its recovery mode near 1.0650 in European trading on Friday. A recovery in risk sentiment is helping the pair, as the safe-haven US Dollar pares gains. Earlier today, reports of an Israeli strike inside Iran spooked markets. 

EUR/USD News

GBP/USD recovers toward 1.2450 after UK Retail Sales data

GBP/USD recovers toward 1.2450 after UK Retail Sales data

GBP/USD is rebounding toward 1.2450 in early Europe on Friday, having tested 1.2400 after the UK Retail Sales volumes stagnated again in March, The pair recovers in tandem with risk sentiment, as traders take account of the likely Israel's missile strikes on Iran. 

GBP/USD News

Gold price defends gains below $2,400 as geopolitical risks linger

Gold price defends gains below $2,400 as geopolitical risks linger

Gold price is trading below $2,400 in European trading on Friday, holding its retreat from a fresh five-day high of $2,418. Despite the pullback, Gold price remains on track to book the fifth weekly gain in a row, supported by lingering Middle East geopolitical risks.

Gold News

Bitcoin Weekly Forecast: BTC post-halving rally could be partially priced in Premium

Bitcoin Weekly Forecast: BTC post-halving rally could be partially priced in

Bitcoin price shows no signs of directional bias while it holds above  $60,000. The fourth BTC halving is partially priced in, according to Deutsche Bank’s research. 

Read more

Geopolitics once again take centre stage, as UK Retail Sales wither

Geopolitics once again take centre stage, as UK Retail Sales wither

Nearly a week to the day when Iran sent drones and missiles into Israel, Israel has retaliated and sent a missile into Iran. The initial reports caused a large uptick in the oil price.

Read more

Forex MAJORS

Cryptocurrencies

Signatures