|

EUR/JPY Price Analysis: Euro steadies near 162.00 as technical signals diverge

  • EUR/JPY trades around the 162.00 zone after a quiet session with slight downside pressure.
  • Technical bias is neutral, with mixed intraday signals offering little directional conviction.
  • Short-term indicators remain flat, while longer-term averages suggest underlying support.

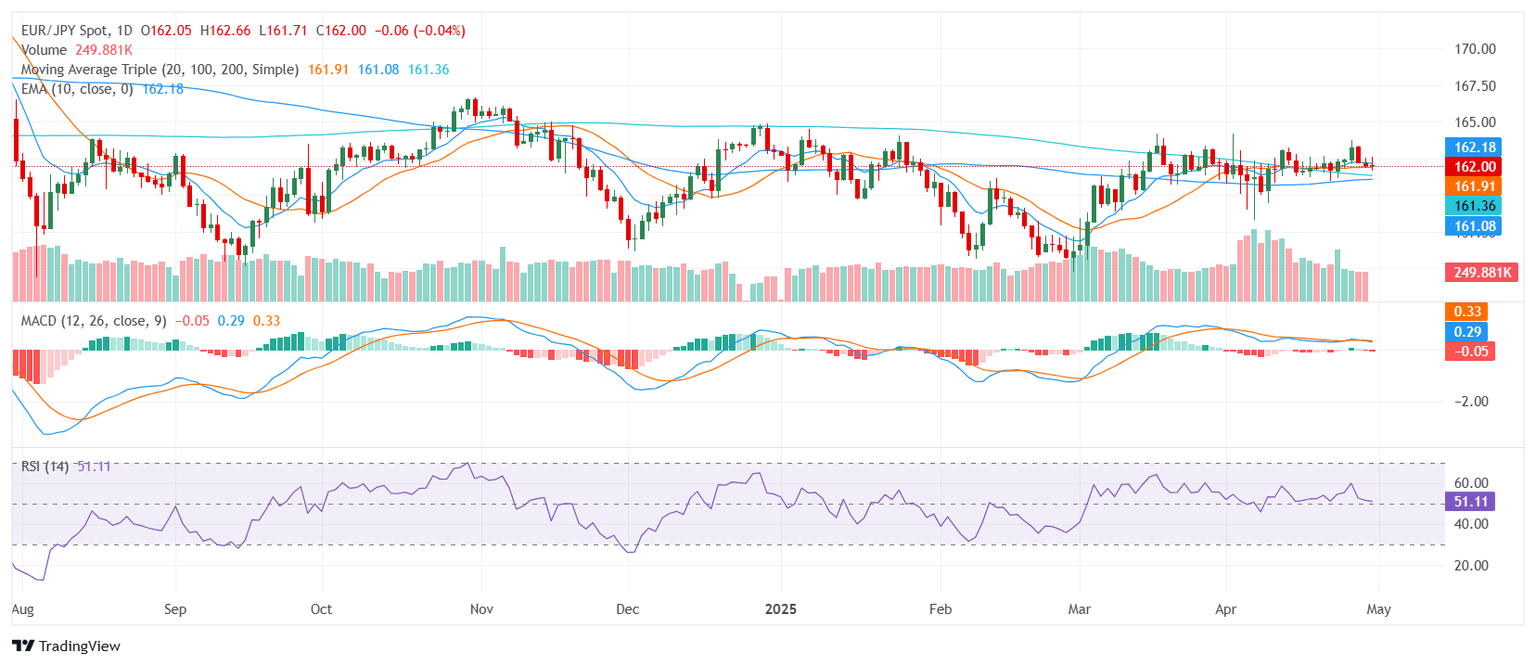
The EUR/JPY pair moved modestly lower on Wednesday, holding near the 162.00 area as it heads into the Asian session. Price action remained contained within a tight daily range, reflecting indecision among traders. Momentum indicators such as the Relative Strength Index and Williams Percent Range are neutral, while the MACD points to mild bearish pressure. However, longer-term moving averages continue to lean bullish, keeping the broader outlook supported despite the short-term stagnation.

EUR/JPY is currently exhibiting a neutral stance. The Relative Strength Index is hovering near 51, reinforcing the lack of momentum in either direction. The MACD, however, has turned lower and now flashes a sell signal, hinting at softening demand. Both the Stochastic %K and Williams Percent Range confirm the indecision, holding at neutral levels that reflect the absence of overbought or oversold conditions.

Looking at trend indicators, the 20-day, 100-day, and 200-day Simple Moving Averages are all positioned below the market and point upward, offering a supportive structure in the medium term. In contrast, the Ichimoku Base Line remains flat and neutral, failing to confirm directional strength in the near term.

Immediate support rests at 161.91, followed by 161.81 and 161.78. Resistance is seen at 161.96, 162.00, and 162.17.

Daily Chart

Author

Patricio Martín

Patricio is an economist from Argentina passionate about global finance and understanding the daily movements of the markets.

More from Patricio Martín
Share:

Editor's Picks

EUR/USD looks to regain the 200-day SMA

EUR/USD regains some balance and trade just above 1.1600 the figure ahead of the opening bell in Asia. The pair initially dipped to the 1.1530 zone for the first time since November, always following the stronger US Dollar and the marked flight-to-safety in the context of the ongoing Middle East crisis
 

GBP/USD attacks 1.3300, refreshing three-month lows

GBP/USD is deep in the red near 1.3300, accelerating its downside to renew three-month lows in European trading on Tuesday. The ongoing escalation in the Iran war, combined with rising Oil prices, weighs negatively on the higher-yielding Pound Sterling as the US Dollar capitalizes on increased haven demand.

Gold bounces off lows, back above $5,100

Gold remains on the defensive, eroding part of the recent multi-day advance and managing to trade back above the $5,100 mark per troy ounce on Tuesday. The precious metal initially dropped just below the critical $5,000 threshold on the back of the persistent strength of the Greenback, higher US Treasury yields across the curve and investors' repricing of Fed rate cuts.

XRP risks extending losses as US-Iran war rages on

Ripple (XRP) has come under pressure, drifting lower to $1.35 at the time of writing on Tuesday. The over 2% correction looks poised to erase the previous day’s gains, which lifted the remittance token to $1.42.

Energy shock 2.0: Why rising Gas prices could hit the Euro

Even without a confirmed, sustained disruption, the mere risk to a key global energy chokepoint is enough to inject a significant premium into European Gas markets. And for the Euro, that matters.

Ripple falters amid sell-off jitters and negative funding rates

Ripple (XRP) has come under pressure, drifting lower to $1.35 at the time of writing on Tuesday. The over 2% correction looks poised to erase the previous day’s gains, which lifted the remittance token to $1.42.