EUR/JPY extends gains as Yen Softens, momentum indicators remains bullish
- EUR/JPY extends gains on Friday, rebounding from a two-day losing streak.
- The cross is trading around 172.40, its highest level since July 17, 2024.
- The technical structure remains bullish, with the RSI at 72.85 signaling overbought conditions, but no signs of a reversal.

The Euro (EUR) extends its advance against the Japanese Yen (JPY) on Friday, rebounding from a two-day losing streak as the Japanese currency remains broadly weaker against its major peers. The EUR/JPY cross has been trading on the front foot for the past seven weeks, underpinned by sustained policy divergence between the European Central Bank (ECB) and the Bank of Japan (BoJ).
The EUR/JPY cross is edging higher during the American trading hours. At the time of writing, trading around the 172.40 mark, a level last seen on July 17, 2024, marking a fresh year-to-date high. The pair is up 0.67% on the day, supported by broad-based Yen weakness and sustained bullish momentum amid ongoing policy divergence between the European Central Bank (ECB) and Bank of Japan (BoJ).
The ECB has firmly shifted into a rate-cutting cycle, as inflation shows clearer signs of retreating toward the 2% target. While the ECB aims to balance price stability with economic growth, recent statements suggest that the current rate-cutting cycle may be nearing its end, acknowledging lingering uncertainties, particularly those stemming from global trade policies. On the other hand, the BoJ has taken a more cautious approach to policy normalization, maintaining its benchmark rate at 0.50% since January. The BoJ has also announced a gradual reduction in JGB purchases, signaling a slow unwind of stimulus while remaining focused on sustaining a healthy wage-price cycle. This divergence in pace and direction continues to drive upward momentum in the EUR/JPY cross.
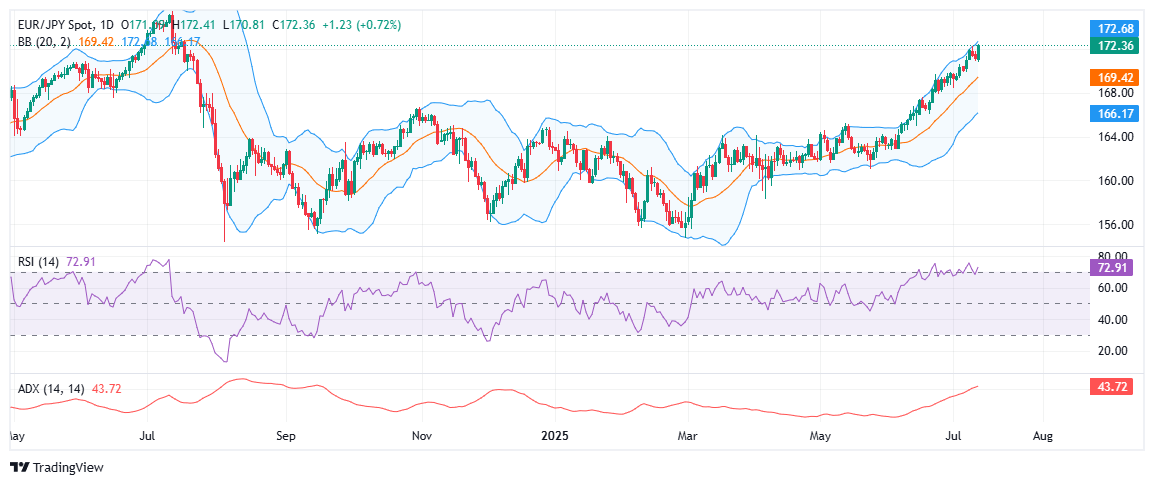
Technically, EUR/JPY maintains its bullish trajectory, trading near 172.40 during Tuesday’s American session. The cross remains well-supported above the ascending 20-day Simple Moving Average (SMA), currently at 169.42, which also serves as the middle line of the Bollinger Bands. The cross continues to press against the upper boundary of the Bollinger Bands, reflecting sustained upside momentum. The recent breakout above the 170.00 psychological level has further reinforced the bullish structure, with no immediate signs of exhaustion.
Momentum indicators further support the bullish bias. The Relative Strength Index (RSI) stands at 72.85, indicating overbought conditions but not yet signaling a reversal, suggesting that buying pressure remains intact. The Average Directional Index (ADX) is rising and currently prints at 43.72, indicating a strong trend in place.
On the downside, immediate support lies at the 170.00 psychological level, followed by the middle Bollinger Band near the 169.50 mark. As long as these levels hold, the broader bias remains tilted to the upside, with potential for the pair to test the 173.00-174.00 zone in the sessions ahead.
Author

Vishal Chaturvedi
FXStreet
I am a macro-focused research analyst with over four years of experience covering forex and commodities market. I enjoy breaking down complex economic trends and turning them into clear, actionable insights that help traders stay ahead of the curve.