EUR/GBP Technical Analysis: Euro rises above 0.9000 figure against GBP - Can it last?

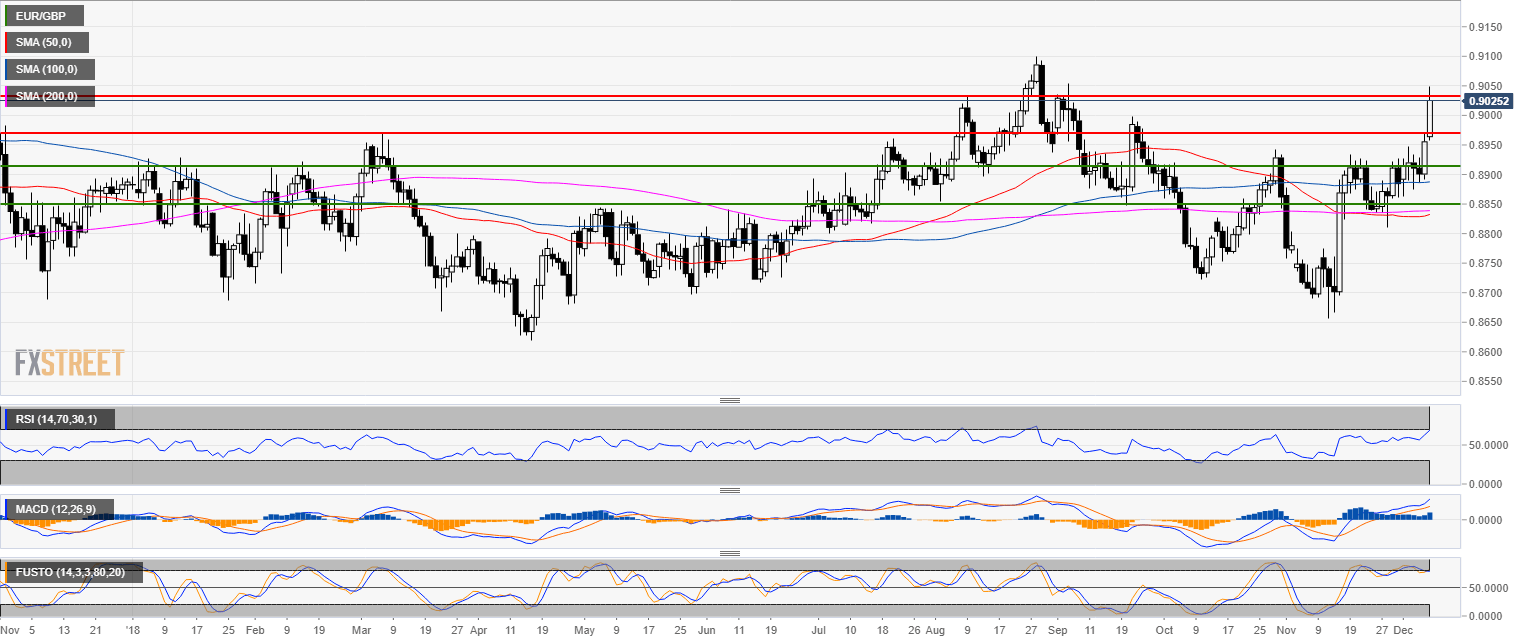
EUR/GBP daily chart
- EUR/GBP is trading in a bull trend above a flat 200-day simple moving average.
- EUR/GBP exceeded the 0.9000 round figure.
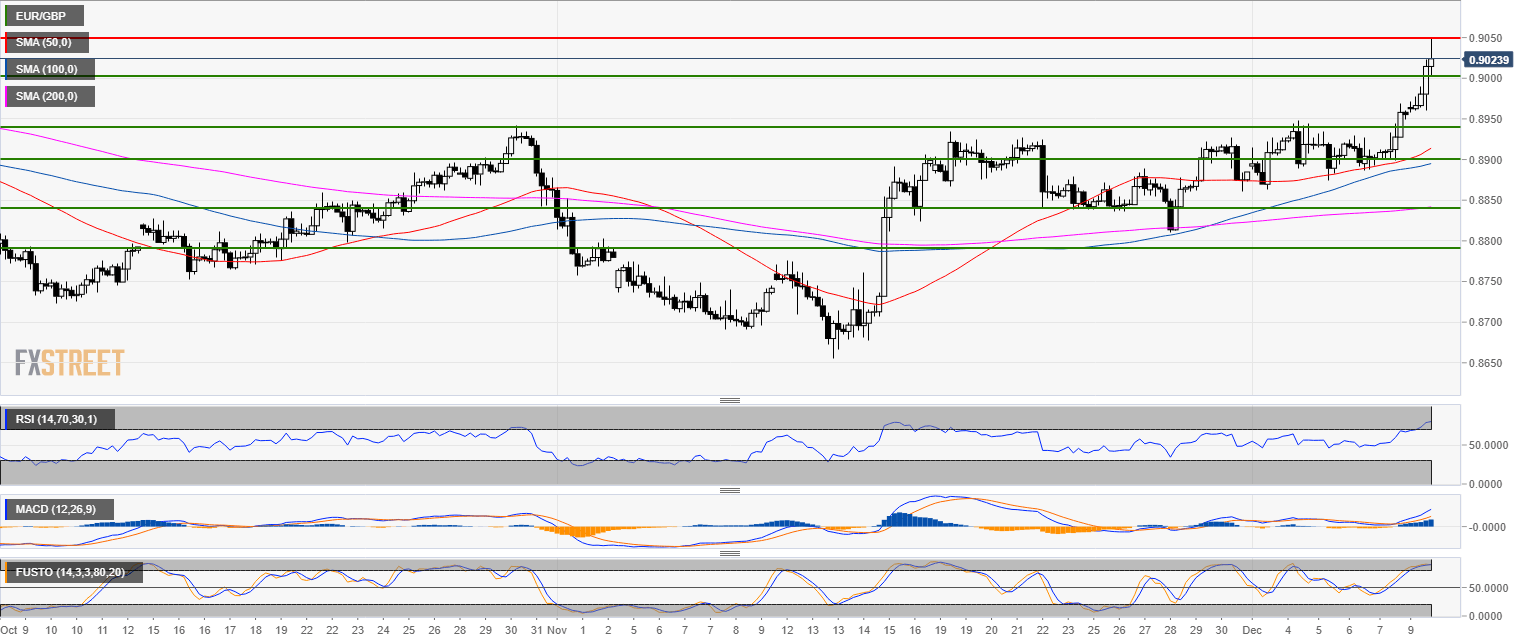
EUR/GBP 4-hour chart
- The 0.9050 level is the new resistance to beat for bulls.
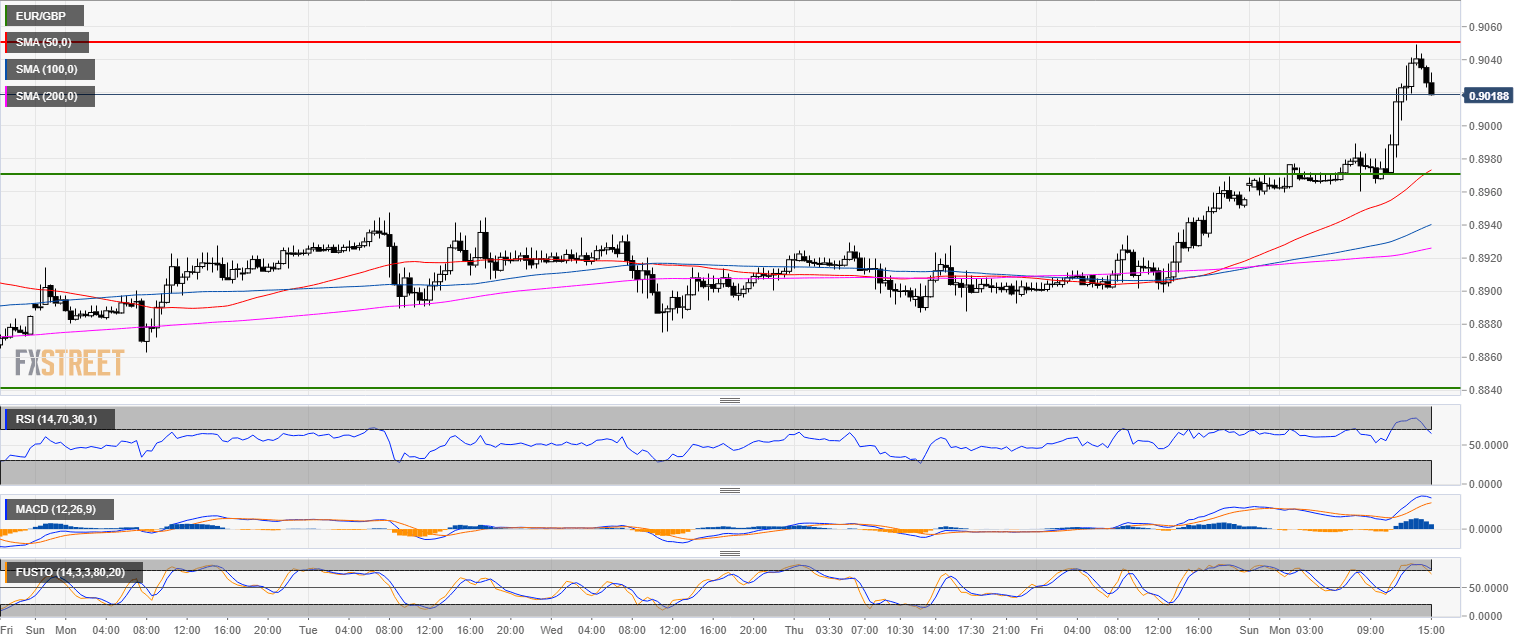
EUR/GBP 30-minute chart
- On small time frames, the bullish momentum is slowing down, suggesting a potential pullback towards the 0.8970 level.
Additional key levels
EUR/GBP
Overview:
Today Last Price: 0.9022
Today Daily change: 67 pips
Today Daily change %: 0.748%
Today Daily Open: 0.8955
Trends:
Previous Daily SMA20: 0.8865
Previous Daily SMA50: 0.883
Previous Daily SMA100: 0.8887
Previous Daily SMA200: 0.8839
Levels:
Previous Daily High: 0.897
Previous Daily Low: 0.8888
Previous Weekly High: 0.897
Previous Weekly Low: 0.8863
Previous Monthly High: 0.8932
Previous Monthly Low: 0.8656
Previous Daily Fibonacci 38.2%: 0.8939
Previous Daily Fibonacci 61.8%: 0.892
Previous Daily Pivot Point S1: 0.8906
Previous Daily Pivot Point S2: 0.8856
Previous Daily Pivot Point S3: 0.8823
Previous Daily Pivot Point R1: 0.8988
Previous Daily Pivot Point R2: 0.902
Previous Daily Pivot Point R3: 0.907
Author

Flavio Tosti
Independent Analyst


