|

EUR/GBP Price Analysis: Soars following UK inflation release, eyes key technical levels

  • EUR/GBP tests 20-day EMA ahead of challenging the 0.8600 figure.
  • Oscillators portray buyers gaining momentum in the near term; long-term, further EUR/GBP downside is expected.
  • The EUR/GBP YTD low at 0.8518 could be the next support.

EUR/GBP rallies on Wednesday, after the release of inflation in the UK, spurred a knee-jerk reaction, with most Pound Sterling (GBP) Currency pairs gaining to the detriment of the GBP. At the time of writing, the EUR/GBP is trading at 0.8597, above its opening price by 0.52%, after hitting a low of 0.8524.

EUR/GBP Price Analysis: Technical outlook

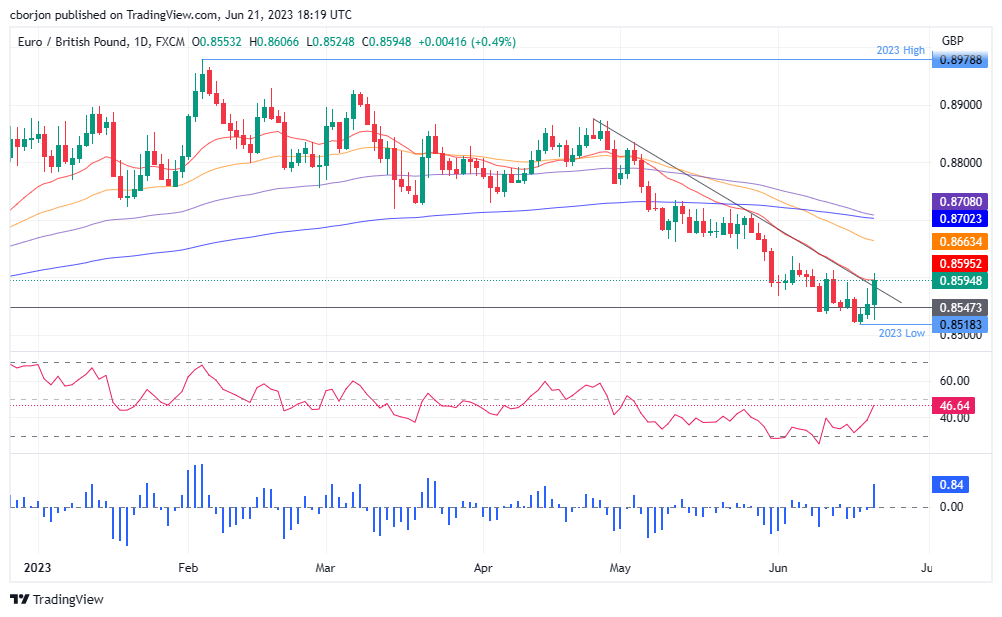
From a daily chart perspective, the EUR/GBP is downward biased, though testing the 20-day Exponential Moving Average (EMA) at 0.8595, which, if breached, will put the 0.8600 figure for grabs. It should be said; in the near term, the EUR/GBP bias is neutral to slightly upward, as the Relative Strength Index (RSI) indicator aims up, about to turn bullish. Moreover, the three-day Rate of Change (RoC) is the largest since March 23.

If the EUR/GBP surpasses those levels, the next stop would be the 50-day EMA at 0.8664. Upside risks lie at the confluence of the 200 and the 100-day EMAs, at 0.8702 and 0.8708, respectively. However, if EUR/GBP resumes its downtrend, the first support would be the June 20 daily high at 0.8581, followed by the psychological 0.8550 area. Once broken, the EUR/GBP's next support would be the year-to-date (YTD) low of 0.8518.

EUR/GBP Price Action – Daily chart

EUR/GBP Daily chart

EUR/GBP

Overview
Today last price0.8595
Today Daily Change0.0041
Today Daily Change %0.48
Today daily open0.8554
 
Trends
Daily SMA200.8602
Daily SMA500.87
Daily SMA1000.8765
Daily SMA2000.8752
 
Levels
Previous Daily High0.8581
Previous Daily Low0.8527
Previous Weekly High0.8613
Previous Weekly Low0.8522
Previous Monthly High0.8835
Previous Monthly Low0.8583
Daily Fibonacci 38.2%0.856
Daily Fibonacci 61.8%0.8548
Daily Pivot Point S10.8527
Daily Pivot Point S20.85
Daily Pivot Point S30.8473
Daily Pivot Point R10.8581
Daily Pivot Point R20.8608
Daily Pivot Point R30.8635

Author

Christian Borjon Valencia

Christian Borjon began his career as a retail trader in 2010, mainly focused on technical analysis and strategies around it. He started as a swing trader, as he used to work in another industry unrelated to the financial markets.

More from Christian Borjon Valencia
Share:

Markets move fast. We move first.

Orange Juice Newsletter brings you expert driven insights - not headlines. Every day on your inbox.

By subscribing you agree to our Terms and conditions.

Editor's Picks

EUR/USD climbs toward 1.1800 on broad USD weakness

EUR/USD gathers bullish momentum and advances toward 1.1800 in the second half of the day on Tuesday. The US Dollar weakens and helps the pair stretch higher after the employment report showed that Nonfarm Payrolls declined by 105,000 in October before rising by 64,000 in November.

GBP/USD climbs to fresh two-month high above 1.3400

GBP/USD gains traction in the American session and trades at its highest level since mid-October above 1.3430. The British Pound benefits from upbeat PMI data, while the US Dollar struggles to find demand following the mixed employment figures and weaker-than-forecast PMI prints, allowing the pair to march north.

Gold extends its consolidative phase around $4,300

Gold trades in positive above $4,300 after spending the first half of the day under bearish pressure. XAU/USD capitalizes on renewed USD weakness after the jobs report showed that the Unemployment Rate climbed to 4.6% in November and the PMI data revealed a loss of growth momentum in the private sector in December. 

US Retail Sales virtually unchanged at $732.6 billion in October

Retail Sales in the United States were virtually unchanged at $732.6 billion in October, the US Census Bureau reported on Tuesday. This print followed the 0.1% increase (revised from 0.3%) recorded in September and came in below the market expectation of +0.1%.

Ukraine-Russia in the spotlight once again

Since the start of the week, gold’s price has moved lower, but has yet to erase the gains made last week. In today’s report we intend to focus on the newest round of peace talks between Russia and Ukraine, whilst noting the release of the US Employment data later on day and end our report with an update in regards to the tensions brewing in Venezuela.

BNB Price Forecast: BNB slips below $855 as bearish on-chain signals and momentum indicators turn negative

BNB, formerly known as Binance Coin, continues to trade down around $855 at the time of writing on Tuesday, after a slight decline the previous day. Bearish sentiment further strengthens as BNB’s on-chain and derivatives data show rising retail activity.