|

EUR/GBP Price Analysis: Bulls flex their muscles and threaten the 200-day SMA

  • EUR/GBP closed Thursday at 0.8670, up by 0.20%, hitting a daily high of 0.8695 near the 200-day SMA.
  • The daily and four-hour chart flashes bullish signals.
  • The 20-day SMA and 100-day SMA are about to perform a bullish cross on the daily chart.

On Thursday, the EUR/GBP cross gained further momentum, closing towards the 0.8670 area, and has already gained 1.34% in September.

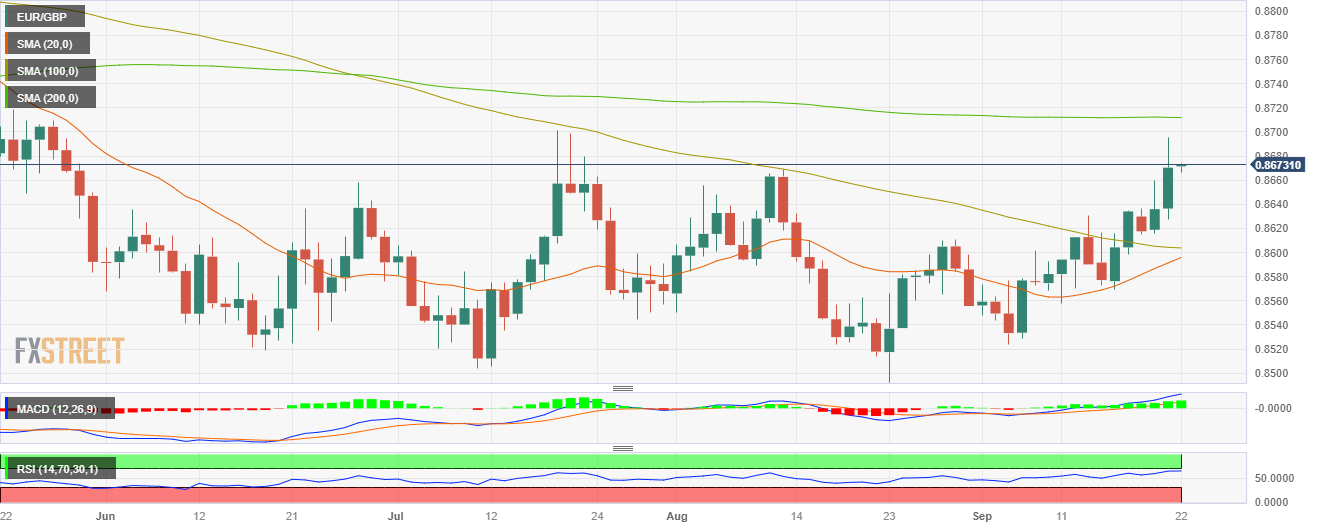
In line with that, the daily chart indicates that the technical outlook favours the bulls over the bears. The Relative Strength Index (RSI) and Moving Average Convergence Divergence (MACD) are comfortably placed on the daily chart in positive territory. Moreover, the pair is above the 20 and 100-day Simple Moving Averages (SMAs), but below the 200-day SMA, suggesting that the bears struggle to challenge the overall bullish trend. Traders should eye the convergence of the 20 and 100-day averages towards the 0.8600 area, which seems to be about to perform a bullish cross, which could boost the buying impulse.

On the four-hour chart, technical indicators also point to a clear dominance of the bulls, with the RSI printing a slight upward slope near the 70 threshold while the MACD displays flat green bars.

Support Levels: 0.8630, 0.8600 (20 and 100-day SMA convergence), 0.8570.

Resistance Levels: 0.8700, 0.8710 (200-day SMA), 0.8750.

EUR/GBP Daily chart

EUR/GBP

Overview
Today last price0.867
Today Daily Change0.0034
Today Daily Change %0.39
Today daily open0.8636
 
Trends
Daily SMA200.8587
Daily SMA500.8589
Daily SMA1000.8605
Daily SMA2000.8712
 
Levels
Previous Daily High0.866
Previous Daily Low0.8616
Previous Weekly High0.8631
Previous Weekly Low0.8558
Previous Monthly High0.8669
Previous Monthly Low0.8493
Daily Fibonacci 38.2%0.8643
Daily Fibonacci 61.8%0.8633
Daily Pivot Point S10.8615
Daily Pivot Point S20.8594
Daily Pivot Point S30.8571
Daily Pivot Point R10.8658
Daily Pivot Point R20.8681
Daily Pivot Point R30.8702


Author

Patricio Martín

Patricio is an economist from Argentina passionate about global finance and understanding the daily movements of the markets.

More from Patricio Martín
Share:

Editor's Picks

GBP/USD remains in two-day highs around 1.3260

GBP/USD adds to Friday’s bounce, gathering fresh traction and flirting with the 1.3270 zone on Monday, or two-day tops. Cable’s decent advance comes despite the move higher in the Greenback and investors’ assessing of UK PM K. Starmer's resignation.

EUR/USD remains offered; focus is on 1.1400

EUR/USD rapidly gives back Friday’s rebound and trades with marked losses near 1.1420, or three-month lows, in the latter part of Monday’s NA session. The pair’s intensifies its retracement following the continuation of the robust upside momentum in the US Dollar. Next on tap will be preliminary PMIs the Germany and the Euroland.

Gold bounces off lows, looks to surpass $4,200

Gold regains composure and leaves behind three-consecutive daily declines on Monday, looking to regain the area above the $4,200 mark per troy ounce. Reports of progress in the latest round of US-Iran talks are helping the precious metal maintain its footing at the start of the week, although the stronger Greenback seems to limit the upside potential for now.

XRP recovery underpinned by persistent ETF inflows
Ripple (XRP) gains momentum on Monday, trading above $1.15 as the crypto market widely recovers. This recovery comes amid easing geopolitical tensions in the Middle East, following reports that the United States (US) and Iran made progress in the first round of talks aimed at achieving a lasting peace agreement.
Is Shiba Inu dead or just in a crisis? The data behind SHIB's 95% crash

SHIB, the dog-themed meme coin that became one of the biggest success stories in crypto and turned early buyers into crypto millionaires, is facing tough times. Its price has fallen more than 32% so far this year, and it is down 95% from its all-time high in 2021. Is SHIB simply another fading meme coin, or is the market overlooking a possible recovery story?

Regime change: Inside Kevin Warsh's first move to make the Fed unreadable on purpose

The rate did not move. That was the least interesting thing about Kevin Warsh's first meeting in charge of the Fed. The FOMC held its benchmark at 3.50%-3.75% for the fourth straight meeting, exactly as priced, and then the new chair used his first press conference to dismantle the machinery the market has leaned on for a decade.