EUR/CAD Price Forecast: Remains below 1.4850, next barrier at a pullback resistance
- EUR/CAD may find an immediate barrier around a “pullback resistance” at the 1.4870 level.
- The 14-day RSI remains below the 50 level; a further decline toward the 30 mark would strengthen bearish bias.
- The psychological level of 1.4800 appears as the immediate support for the pair.

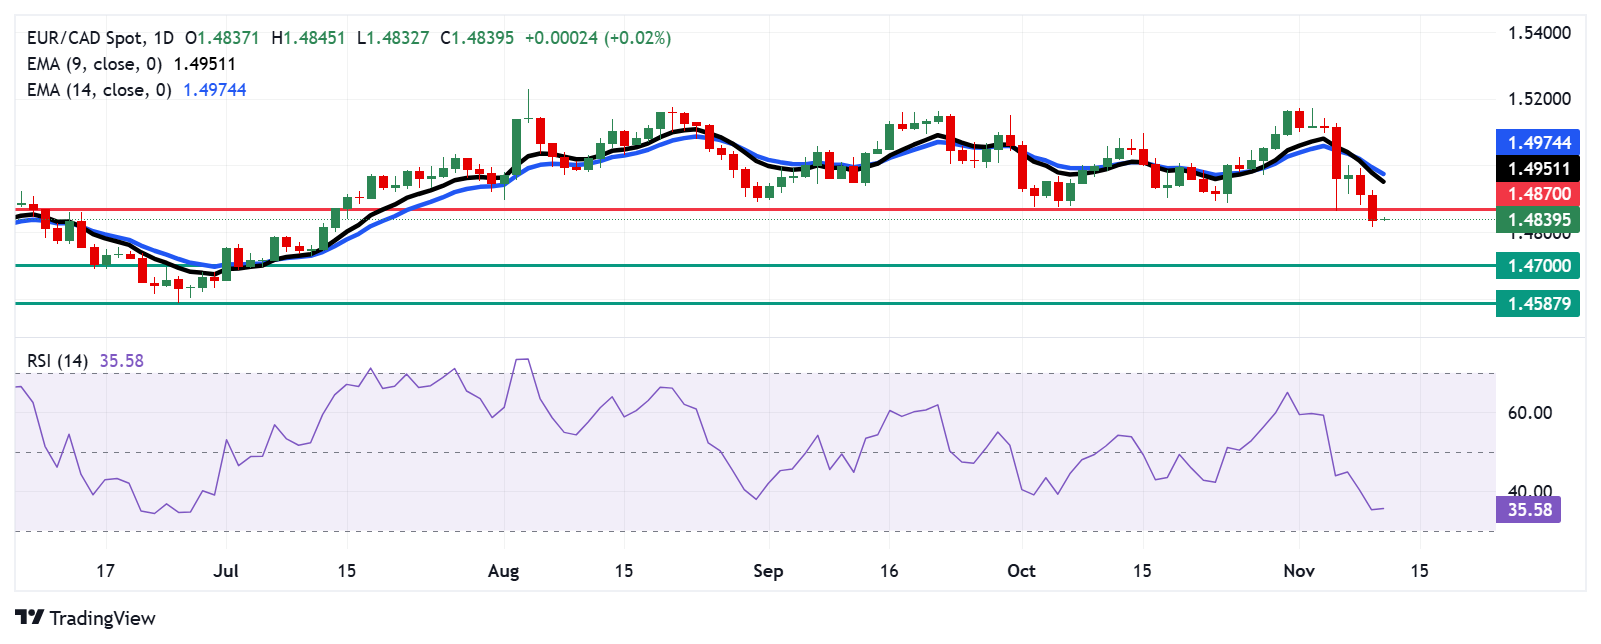
The EUR/CAD cross attempts to halt its two days of losses, trading around 1.4840 during the Asian session on Tuesday. An analysis of the daily chart highlights a strong bearish bias, as the pair remains below the nine-day Exponential Moving Average (EMA).
The 14-day Relative Strength Index (RSI), a key momentum indicator, stays below the 50 level, indicating sustained bearish momentum. A further dip toward the 30 level would intensify this downward trend for the EUR/CAD cross.
Additionally, the nine-day Exponential Moving Average (EMA) remains below the 14-day EMA, signaling continued weakness in short-term price momentum for the EUR/CAD cross.
On the downside, the EUR/CAD cross may test the psychological level of 1.4800, followed by the key level of 1.4700. A break below the latter could put downward pressure on the pair to navigate the region around its seven-month low of 1.4587 level.
Regarding the resistance, the EUR/CAD cross finds an immediate barrier around “throwback support” turned “pullback resistance” at the 1.4870 level. A break above the level could lead the pair to test the nine-day EMA at 1.4951 level, followed by the 14-day EMA at 1.4974 level.
EUR/CAD: Daily Chart
Euro PRICE Today
The table below shows the percentage change of Euro (EUR) against listed major currencies today. Euro was the strongest against the Australian Dollar.
| USD | EUR | GBP | JPY | CAD | AUD | NZD | CHF | |
|---|---|---|---|---|---|---|---|---|
| USD | 0.14% | 0.23% | -0.02% | 0.16% | 0.33% | 0.09% | 0.07% | |
| EUR | -0.14% | 0.09% | -0.16% | 0.02% | 0.19% | -0.05% | -0.07% | |
| GBP | -0.23% | -0.09% | -0.26% | -0.06% | 0.10% | -0.15% | -0.15% | |
| JPY | 0.02% | 0.16% | 0.26% | 0.19% | 0.36% | 0.12% | 0.11% | |
| CAD | -0.16% | -0.02% | 0.06% | -0.19% | 0.17% | -0.06% | -0.09% | |
| AUD | -0.33% | -0.19% | -0.10% | -0.36% | -0.17% | -0.22% | -0.25% | |
| NZD | -0.09% | 0.05% | 0.15% | -0.12% | 0.06% | 0.22% | -0.03% | |
| CHF | -0.07% | 0.07% | 0.15% | -0.11% | 0.09% | 0.25% | 0.03% |
The heat map shows percentage changes of major currencies against each other. The base currency is picked from the left column, while the quote currency is picked from the top row. For example, if you pick the Euro from the left column and move along the horizontal line to the US Dollar, the percentage change displayed in the box will represent EUR (base)/USD (quote).
Author

Akhtar Faruqui
FXStreet
Akhtar Faruqui is a Forex Analyst based in New Delhi, India. With a keen eye for market trends and a passion for dissecting complex financial dynamics, he is dedicated to delivering accurate and insightful Forex news and analysis.


